Economic Snapshot
2025 Financial Year in Review
The 2025 financial year unfolded in two distinct phases. The first six months were marked by strong equity market performance, supported by solid corporate earnings, stable economic growth, and declining inflation trending towards central bank targets. As the calendar year began, geopolitical uncertainty took hold, with US trade policy becoming a key concern for markets. Fears over the impact of tariffs on inflation and growth prompted an investor shift away from US equities, increased interest in European markets, and greater volatility in bond yields. Investor demand for gold also rose as risk aversion returned to the forefront.
Key market and macroeconomic developments over the 2025 financial year
| Jul 2024 | Global equities saw significant gains despite increased volatility. Australian and US equities reached new all-time highs. A sector rotation was evident, as high-performing growth stocks retreated in favour of small-cap, cyclical, and value-oriented companies. Consumer discretionary and financials led Australian gains, with the Commonwealth Bank becoming the largest Australian company by market capitalisation. The US market saw strong small-cap performance, with the Russell 2000 up 10.1%. Commodity prices weakened, except gold, which surged 4.1%. Lower inflation and easing rate expectations boosted Australian and US bond markets. Globally, disinflation and softening labour markets suggested central banks were more likely to ease rates. |
| Aug 2024 | Global markets experienced significant volatility before ending well off their lows. The MSCI World Index (AUD) fell 1.18%, driven by weak US labour data, the unwinding of the yen carry trade and geopolitical tensions. Australian equities saw mixed performance, with the S&P/ASX All Ordinaries up 0.4% and small caps down 2.02%. US markets rebounded, supported by strong GDP data and earnings, while Asian and European equities showed mixed results. Global bond markets rallied as inflation moderated, and rate cuts became more likely. Inflation cooling and earnings optimism supported the outlook for a “Soft Landing” scenario. |
| Sep 2024 | Global equity markets surged, buoyed by a significant 50-basis point rate cut by the US Federal Reserve (Fed). Aggressive Chinese stimulus measures lifted Chinese shares, with the Shanghai Composite Index rallying 21%. The MSCI World Index (USD) rose 1.87%, with Australian equities reaching record highs as the S&P/ASX All Ordinaries gained 3.45%. The materials and technology sectors led gains, while defensive sectors lagged. Commodities rallied, with gold up 6.2% and copper rising 12.9%. Inflation cooled globally, supporting monetary easing, but risks of economic slowdown persisted as labour markets softened, and consumer trends continued to show signs of weakness. |
| Oct 2024 | Equity markets pulled back marginally in October. However, government bonds saw high levels of volatility amidst a significant sell-off. Strong economic growth in the US and resilient labour market data domestically and in the US led to a recalibration of interest rate expectations, resulting in higher bond yields. The Australian dollar depreciated sharply as the US dollar gained against major currencies. The US Presidential election added to market volatility as investors responded to swings in the election polls. The US earnings season produced broadly stronger earnings, which were overshadowed by disappointing outlooks from some mega-cap technology companies. |
| Nov 2024 | Equity markets rallied following a resounding US election victory for Donald Trump, with his administration widely expected to introduce domestically focused growth policies. US and Australian share markets gained significantly, while other global markets, especially emerging markets, lagged as capital flowed to sectors expected to benefit from the Trump administration’s expected policy direction. The S&P 500 Index (USD) increased by 5.9%, the biggest monthly gain of the calendar year, but gains were more pronounced for small caps with the S&P Small Cap 600 Index rising by 10.9%. Bond markets experienced initial volatility post the election but ultimately stabilised, with US bonds ending the month stronger. |
| Dec 2024 | Global equities experienced a subdued finish to the year, with the MSCI World Index (USD) declining by 2.6% in December. While the Fed announced an anticipated third consecutive interest rate cut, bond and equity markets reacted negatively. The Fed’s outlook proved more hawkish than expected, indicating only a 0.5% reduction in rates is anticipated for 2025. As US bond yields increased, the US dollar strengthened, exerting further pressure on the Australian dollar, which continued its downward trend. This recalibration of higher interest rate expectations did not overshadow a strong year for equity investors. |
| Jan 2025 | Global equities had a strong start to 2025, with the MSCI World Index (USD) up 3.6%, driven by optimism around monetary policy easing and resilient earnings. The US S&P 500 (USD) rose 2.8%, though tech underperformed with the Nasdaq gaining just 1.6% due to a sharp 17% drop in Nvidia. European markets outperformed, up 6.3%, buoyed by European Central Bank rate cut expectations. Australian equities rallied 4.4%, led by consumer discretionary and financial sectors, as markets priced in a potential Reserve Bank of Australia (RBA) rate cut. Commodities surged, with gold hitting a record $2832/oz (+7%) on safe-haven demand, driven largely by increasing trade tensions. Bond yields spiked mid-month on inflation fears but later eased; US 10-year yields closed at 4.55%, and Australian 10-years at 4.43%. |
| Feb 2025 | Equity markets softened in February, with US markets dragged down by the tech-heavy Nasdaq. Despite a solid earnings season, investors’ enthusiasm for Artificial Intelligence waned. Hopes of a potential end to the Ukraine war, as well as positive economic data, saw European equities rise. Despite a solid earnings season and the RBA’s first rate cut since 2020, Australian equities fell 4%, erasing most year-to-date gains. Amid trade tensions, gold continued its rise, up 1.5%, while bond markets globally rallied. Driven by softer economic data, US 10-year yields dropped 35bps to 4.2%, with Australian 10-year yields following, down to 4.34% |
| Mar 2025 | March was marked by heightened uncertainty surrounding President Trump’s tariff threats, significantly weakening investor sentiment. Global equities fell sharply, with the MSCI World Index (USD) down 4.4% and the S&P 500 (USD) plunging 5.6%, as technology stocks led the decline. Australian equities mirrored the global trend, falling 3.5%. As expected in periods of mass geopolitical uncertainty, gold surged, rising 9.6%. Despite the sell-off in equity markets, bond markets traded sideways, with the potential inflationary impacts of tariffs being weighed against a possible slowdown in economic activity. |
| Apr 2025 | US trade policy largely drove markets in April, with the announcement of reciprocal tariffs on “Liberation Day” seeing intra-month declines exceeding 10%. The 90 day pause, announced a week later, aided markets as they recovered most of the intra-month drawdowns. The S&P500 (USD) ended the month down 0.7%, while the Nasdaq 100 (USD) rose 1.5%. The S&P/ASX All Ordinaries advanced 3.6%, driven by the communication services and information technology sectors. A weaker US dollar did not translate into broad support for commodities; however, gold continued its upward trend, rising 5.9%. Bond markets saw considerable volatility, with the US 10-year yield trading in a range of 60 basis points but ending the month down 5 basis points to 4.16%. Australian 10-year yields fell 29 basis points to 4.13%, swayed by falling domestic inflation. |
| May 2025 | Equity markets rallied following a shift toward diplomacy, with the Trump administration engaging in multiple bilateral trade negotiations and the securing of a temporary reduction in tariffs with China. The S&P 500 (USD) rose 6.3%, while the Nasdaq 100 (USD) surged 9.2%. Small caps also followed, as the Russell 2000 (USD) rose 5.8%. Diminished geopolitical concerns coincided with a robust earnings season, with 78% of companies exceeding earnings per share estimates. Australian and European equities followed suit, with the ASX 200 and Euro Stoxx 50 (EUR) rising 4.2% and 6% respectively. Gold prices were muted, posting a modest decline of 0.7%. US bond markets saw increases in yields, with fears that the proposed ‘One Big Beautiful Bill’ will add to the US budget deficit. US 10-year yields rose to 4.39%. Domestically, Australian 10-year yields followed, drifting higher, but to a lesser extent. |
| Jun 2025 | June saw more geopolitical risks for markets, with the outbreak of war and eventual ceasefire between Israel and Iran, testing market resilience. Equity markets reached new highs, with the MSCI World Index (USD) rising 4.3%, largely driven by the US, as the S&P 500 (USD) rose by 4.5%. Europe, on the other hand, saw a decline. The Euro 100 (EUR) fell by 0.5%. The ASX 200 rose, finishing the month up 1.41%, driven by the energy and financials sectors. The conflict between Israel and Iran drove commodity markets, with gold and oil experiencing large bouts of volatility. Gold traded above $3400 USD/ounce, finishing the month at $3310 USD/ounce. WTI crude oil ended the month up 8.5% to $66.66, having traded just below $74 during the month. Bond markets saw general declines in yields, with the US 10-year yield falling 30 basis points and the Australian 10-year yield falling 12 basis points intra-month. |
2025 FINANCIAL YEAR RETURNS
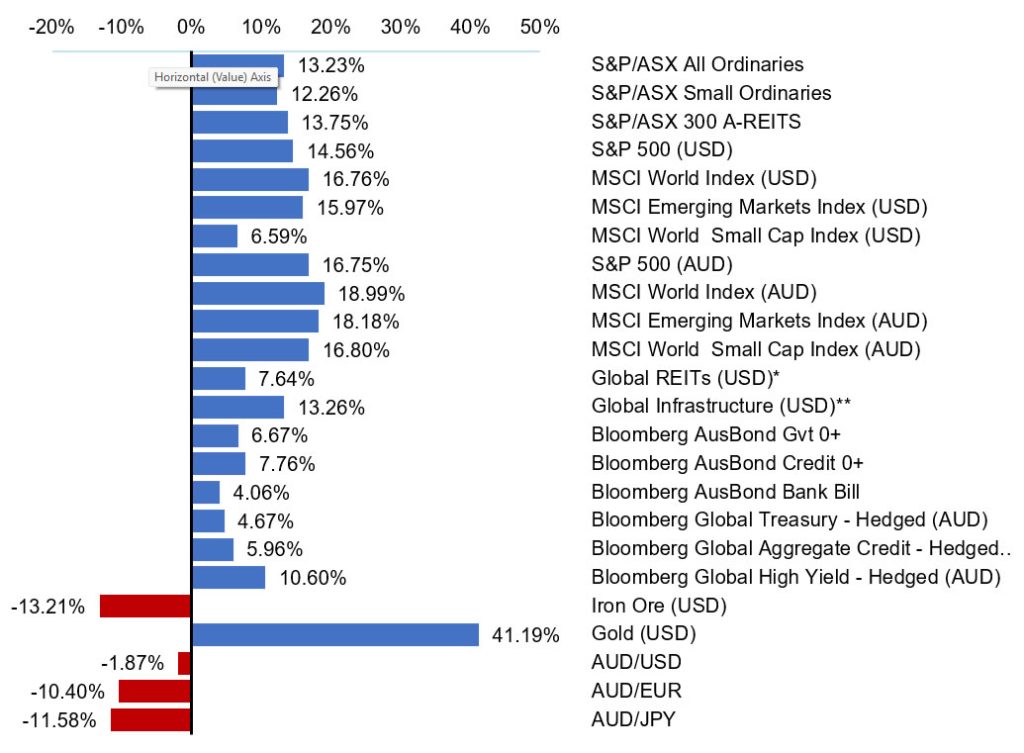
*FTSE EPRA Nareit DEVELOPED, **FTSE Global Core Infrastructure 50/50 Index
Looking ahead
As we enter the 2026 financial year, we maintain a constructive outlook for global economic growth and the performance of both equity and bond markets. However, the path of returns is unlikely to be smooth, with various risks that could influence expectations as the year unfolds.
Structural themes and key risks
The most significant structural driver of markets currently is the evolving policy landscape under President Trump. The push and pull between protectionist trade measures and fiscal stimulus efforts will be a defining influence across asset classes. Markets are likely to remain sensitive to these policy announcements.
The Artificial Intelligence (AI) theme has been a key growth driver for equity markets over the past few years. This trend is likely to continue as spending in the sector remains robust and the productivity benefits for a broader array of corporates and consumers become more evident. The extent of measurable returns on AI investments will be an important factor in AI’s role as a fundamental catalyst for growth.
Global economic growth
The outlook for global economic growth is moderately constructive, though policy uncertainty in the US presents a critical variable. A key consideration is the conflict between “Tariff Trump” and “Pro-Growth Trump.” While signs of fiscal stimulus are emerging through the administration’s “One Big Beautiful Bill”, the resulting fiscal expansion carries risks. In particular, widening deficits may begin to exert pressure on bond markets and investor sentiment, potentially offsetting the intended growth benefits.
Another downside risk stems from the sizeable volume of US debt scheduled for refinancing over the next 12 months. Elevated yields may amplify fiscal concerns and restrict policy flexibility, adding a layer of complexity to the US growth outlook.
In Australia, economic momentum remains subdued. Government spending has underpinned recent growth, while private sector activity has yet to show meaningful recovery. A sustained uplift in private investment would be necessary to shift the domestic economy onto a more dynamic trajectory.
Inflation and central bank policies
Inflation has generally returned to central bank target ranges across most developed economies, prompting the start of rate cutting cycles in many countries. In contrast, while the US has initiated rate cuts, inflation remains a key concern for the Fed. The potential inflationary effects of proposed tariffs have added to the uncertainty, leading the Fed to pause further easing. At the same time, political pressure to lower rates is expected to intensify as President Trump aims to bolster economic activity.
Australia appears positioned for further monetary policy easing. Inflation has decelerated into the RBA’s target range, and with economic growth lagging, the market is now pricing in three rate cuts before year-end. This policy backdrop should provide support for both household confidence and asset prices.
Fixed income markets
Volatility is expected to remain a defining feature of global fixed income markets, particularly in the US. The interplay between fiscal expansion, trade policy uncertainty, and Fed actions suggests a risk that Treasury yields remain elevated and rangebound for an extended period. Meanwhile, credit spreads remain tight, offering more limited compensation for risk.
Australian fixed income presents a more attractive profile. Inflation is contained, a steady path of cash rate cuts is anticipated, and credit spreads remain more reasonably valued compared to global peers. These factors combine to offer a potentially favourable environment for domestic fixed income investors in the coming quarters.
Equity markets and corporate earnings
Corporate earnings have softened globally over the past six months, though US earnings look to have stabilised and remain at relatively healthy levels. That said, valuations across US large-cap equities continue to appear elevated both in a historical context and relative to international markets. This leaves the market vulnerable to downside surprises should earnings growth disappoint.
In Europe, recent equity outperformance has largely been driven by more attractive valuations rather than improving fundamentals, as earnings growth has also declined. Outlooks remain cautious, with muted expectations for earnings expansion in the near term. However, increases in government fiscal spending, particularly from Germany, may support corporate sector earnings on a medium to longer term view.
Australian equities face more pronounced headwinds. Earnings growth expectations are weaker than many other developed markets and valuations remain expensive relative to historical norms. This combination may limit the upside case for domestic large cap equities.
US small-cap stocks have been particularly affected by recent equity market volatility, reflecting heightened uncertainty around the US centric earnings outlook. Small caps continue to trade at a discount to large-cap peers, but this valuation gap may present selective opportunities should macro conditions become more supportive.
Investment implications
Portfolios should remain well-diversified and strategically positioned to optimise returns while managing for uncertainties. Disciplined risk management and a proactive approach to tactical asset allocation will be critical in navigating the coming opportunities and challenges.
Major market indicators
| 30-Jun-25 | 31-May-25 | 30-Apr-25 | Qtr change | 1 year change | |
| Interest Rates (at close of period) | |||||
| Aus 90 day Bank Bills | 3.61% | 3.78% | 4.02% | -51.0 | -78.0 |
| Aus 10yr Bond | 4.16% | 4.35% | 4.27% | -26.1 | -8.2 |
| US 90 day T Bill | 4.24% | 4.25% | 4.20% | +3.0 | -98.0 |
| US 10 yr Bond | 4.23% | 4.39% | 4.16% | +1.9 | -14.1 |
| Currency (against the AUD) | |||||
| US Dollar | 0.655 | 0.644 | 0.640 | 5.17% | -1.87% |
| British Pound | 0.477 | 0.478 | 0.479 | -1.57% | -9.02% |
| Euro | 0.559 | 0.567 | 0.564 | -3.62% | -9.85% |
| Japanese Yen | 94.73 | 92.70 | 91.63 | 1.25% | -11.74% |
| Trade-Weighted Index | 60.10 | 59.60 | 59.90 | 0.84% | -5.06% |
| Equity Markets | |||||
| Australian All Ordinaries | 1.4% | 4.2% | 3.6% | 9.5% | 13.2% |
| MSCI Australia Value (AUD) | 1.5% | 3.0% | 2.9% | 7.5% | 11.5% |
| MSCI Australia Growth (AUD) | 1.6% | 4.9% | 5.3% | 12.2% | 17.8% |
| S&P 500 (USD) | 4.5% | 6.3% | -0.7% | 10.4% | 14.6% |
| MSCI US Value (USD) | 4.5% | 2.7% | -3.5% | 3.4% | 13.2% |
| MSCI US Growth (USD) | 5.8% | 10.0% | 2.5% | 19.3% | 18.2% |
| MSCI World (USD) | 4.3% | 6.0% | 0.9% | 11.6% | 16.8% |
| Nikkei (YEN) | 6.8% | 5.3% | 1.2% | 13.9% | 4.3% |
| CSI 300 (CNY) | 3.3% | 2.0% | -2.9% | 2.4% | 17.4% |
| FTSE 100 (GBP) | 0.0% | 3.8% | -0.7% | 3.2% | 11.3% |
| DAX (EUR) | -0.4% | 6.7% | 1.5% | 7.9% | 31.1% |
| Euro 100 (EUR) | -0.5% | 5.8% | -1.9% | 3.3% | 9.3% |
| MSCI Emerging Markets (USD) | 6.1% | 4.3% | 1.3% | 12.2% | 16.0% |
| Commodities | |||||
| Iron Ore (USD) | -2.1% | -1.6% | -5.4% | -3.7% | -13.2% |
| Crude Oil WTI U$/BBL | 8.5% | 3.2% | -17.1% | 11.9% | -19.5% |
| Gold Bullion $/t oz | 0.0% | -0.7% | 5.9% | -0.7% | 41.2% |
Source: Quilla, Refinitiv, and Datastream