Economic Snapshot
June 2025
Summary
June was a strong month for global financial markets, marked by dramatic geopolitical events that tested and highlighted market resilience. Key developments included:
- The outbreak and swift resolution of direct military conflict between Israel and Iran, with the US intervening in an effort to delay the Iranian nuclear programme. This represented the most significant geopolitical shock to financial markets since the tariff announcements earlier in the year. Despite the initial volatility, markets remained resilient, with major equity indices reaching new highs by month-end.
- Concerns on the trade front further abated through the month, with the confirmation of an agreement between the US and China. The agreement builds on the May truce, with specific agreements on the easing of export restrictions for rare earth minerals from China. While this is welcome news, the end of the 90-day delay in tariffs between the US and other major trading partners is quickly approaching on July 9.
- The US Federal Reserve again opted to hold interest rates steady, due to diminishing, but still elevated, economic uncertainty. In Europe, the European Central Bank delivered a 25 basis point cut.
Selected market returns (%), June 2025
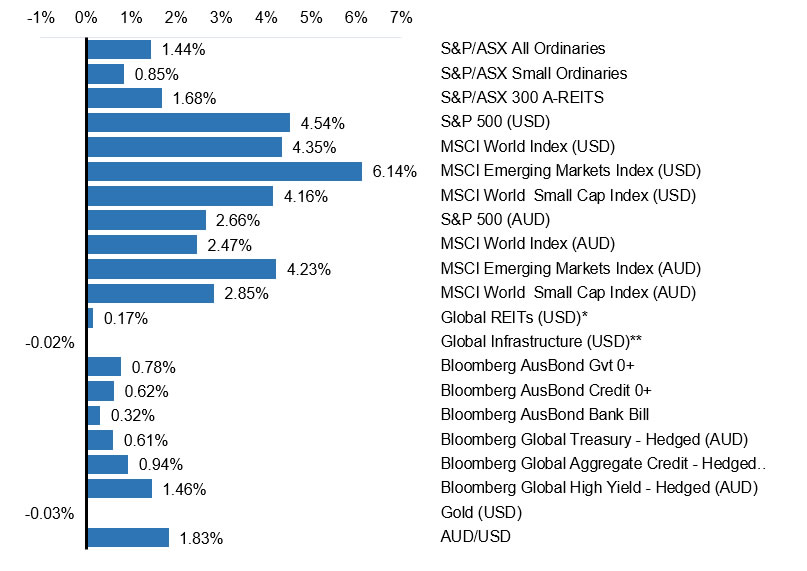
Sources: *FTSE EPRA/NAREIT DEVELOPED, **FTSE Global Core Infrastructure 50/50 Index
Key market and economic developments in June 2025
Financial markets
Global equity markets delivered strong performances in June, driven by improving trade relations and increased investor confidence. News of increased hostility and subsequent US involvement in the conflict between Iran and Israel weighed on markets mid-month. However, the confirmation of a ceasefire buoyed markets into the end of the month, seeing the MSCI World (USD) ending the month up by 4.4%.
Australian equities
The ASX 200 finished the month up 1.4%, closing 1% under its all-time high reached on 11 June. This saw the Australian index post a year-to-date (YTD) gain of 6.4%. The energy sector led the index, posting a 9% return, with the proposed Emirati takeover of Santos (STO) being a major driver. The financials sector continued its recovery from the depths of the “Liberation Day” sell-off off with the sector finishing the month up 4.3%. This was underpinned by the Commonwealth Bank of Australia (CBA), with June seeing Australia’s largest company post a 5% gain, bringing its YTD return to 22%. The materials sector continued its lacklustre year, falling 3.1%.
Global equities
US equity markets spearheaded the global advance, as the S&P 500 (USD) continued its rebound from its low in April. The index rose 4.5%, recovering from the drawdowns at the beginning of the year, finishing the month at all-time highs. The technology sector underpinned the gain, rising 9.8%, with Nvidia (NVDA) up 17%. US small caps followed large caps in their rebound, with the Russell 2000 (USD) rising 5.3%.
European equity markets were broadly weaker, with the Euro 100 (EUR) falling by 0.5%. The German DAX (EUR) followed this trend, decreasing by 0.4%. This was in contrast to Asian markets, with the Nikkei (YEN) rising by 6.8% and CSI 300 (CNY) rising by 3.3%. The Chinese market was buoyed by hopes, and later confirmation, of a trade deal between the US and China, which drove emerging markets, with MSCI Emerging Markets (USD) continuing its impressive 2025, rising 6.1%.
Commodities
Geopolitical concerns, specifically surrounding the Iran-Israel conflict, drove commodity markets, with June characterised by increased volatility. Gold finished the month at $3310 USD/ounce, after rising to $3440 at the peak of the conflict. The conflict also drove a significant rise in WTI Crude from the month’s low of $62.50 to $73.84, ending the month up 8.5% to $66.66. This was in contrast to iron ore, which slid 2.1% for the month.
Bond markets
Moves in the Australian 10-year government bond yield, on the other hand, were more muted, declining from highs of 4.3% to 4.16%.
Economic developments
Australian economic data paves the way for further monetary easing
Following the 25-basis point rate cut delivered by the Reserve Bank of Australia (RBA) in May, market expectations solidified around an additional cut at the July 7-8 policy meeting. The release of Q1 GDP data early in the month fuelled this expectation, with GDP rising by just 0.2% in the quarter and by 1.3% year-on-year to the end of March, continuing the trend of lacklustre growth within the Australian economy. The datapoint came in below the already downwardly revised forecast of 0.4%.
The release of monthly CPI further buoyed expectations of a July rate cut. Monthly CPI slowed from 2.4% in May to 2.1% below economic forecasts of 2.4%. This leaves CPI at the lower end of the RBA’s 2-3% target range. The release also saw a moderation in trimmed mean CPI from 2.8% to 2.4%, also below economists’ forecasts of 2.6%. This broad moderating trend, paired with the continued lack of economic growth, underpins the view of increased monetary easing, with market pricing for interest rate cuts now sitting slightly above the RBA’s May forecast of two to three cuts by the end of the year.
US tariffs remain at the front of investors’ minds
The news of a trade deal between the US and China was welcomed by markets. The agreement, hatched on 26 June, builds on the framework announced earlier in the month. This will see China ease restrictions on the acquisition of Chinese magnets and rare earth minerals by American firms. The US also announced it would stop seeking to revoke the visas of Chinese students. While the easing of tariff tensions between the two nations is positive for markets, the 9 July deadline for the initial 90-day tariff pause is fast approaching.
Despite this, the Trump administration has continued to downplay the deadline, with President Trump noting the impossibility of negotiating trade deals with all nations within that period. Meanwhile, Treasury Secretary Scott Bessent stated that the administration expects negotiations to continue beyond the deadline, with trade agreements involving 10 to 12 of America’s most important trading partners expected to be finalised by September.
Outlook
Despite subdued confidence, economic and market fundamentals have demonstrated notable resilience. However, ongoing uncertainty around economic and political developments reinforces the importance of staying active and vigilant to both risks and opportunities. While downside risks remain and may trigger periods of volatility, several supportive factors continue to underpin global economic growth and market performance.
Major market indicators
| 30-Jun-25 | 31-May-25 | 30-Apr-25 | Qtr change | 1 year change | |
| Interest Rates (at close of period) | |||||
| Aus 90 day Bank Bills | 3.61% | 3.78% | 4.02% | -51.0 | -78.0 |
| Aus 10yr Bond | 4.16% | 4.35% | 4.27% | -26.1 | -8.2 |
| US 90 day T Bill | 4.24% | 4.25% | 4.20% | +3.0 | -98.0 |
| US 10 yr Bond | 4.23% | 4.39% | 4.16% | +1.9 | -14.1 |
| Currency (against the AUD) | |||||
| US Dollar | 0.655 | 0.644 | 0.640 | 5.17% | -1.87% |
| British Pound | 0.477 | 0.478 | 0.479 | -1.57% | -9.02% |
| Euro | 0.559 | 0.567 | 0.564 | -3.62% | -9.85% |
| Japanese Yen | 94.73 | 92.70 | 91.63 | 1.25% | -11.74% |
| Trade-Weighted Index | 60.10 | 59.60 | 59.90 | 0.84% | -5.06% |
| Equity Markets | |||||
| Australian All Ordinaries | 1.4% | 4.2% | 3.6% | 9.5% | 13.2% |
| MSCI Australia Value (AUD) | 1.5% | 3.0% | 2.9% | 7.5% | 11.5% |
| MSCI Australia Growth (AUD) | 1.6% | 4.9% | 5.3% | 12.2% | 17.8% |
| S&P 500 (USD) | 4.5% | 6.3% | -0.7% | 10.4% | 14.6% |
| MSCI US Value (USD) | 4.5% | 2.7% | -3.5% | 3.4% | 13.2% |
| MSCI US Growth (USD) | 5.8% | 10.0% | 2.5% | 19.3% | 18.2% |
| MSCI World (USD) | 4.3% | 6.0% | 0.9% | 11.6% | 16.8% |
| Nikkei (YEN) | 6.8% | 5.3% | 1.2% | 13.9% | 4.3% |
| CSI 300 (CNY) | 3.3% | 2.0% | -2.9% | 2.4% | 17.4% |
| FTSE 100 (GBP) | 0.0% | 3.8% | -0.7% | 3.2% | 11.3% |
| DAX (EUR) | -0.4% | 6.7% | 1.5% | 7.9% | 31.1% |
| Euro 100 (EUR) | -0.5% | 5.8% | -1.9% | 3.3% | 9.3% |
| MSCI Emerging Markets (USD) | 6.1% | 4.3% | 1.3% | 12.2% | 16.0% |
| Commodities | |||||
| Iron Ore (USD) | -2.1% | -1.6% | -5.4% | -3.7% | -13.2% |
| Crude Oil WTI U$/BBL | 8.5% | 3.2% | -17.1% | 11.9% | -19.5% |
| Gold Bullion $/t oz | 0.0% | -0.7% | 5.9% | -0.7% | 41.2% |
Sources: Quilla, Refinitiv Datastream