Summary
Equity markets strengthened in October, recording solid gains with little weakness across regions. Emerging markets continued to deliver solid performance, led by Asian regions as trade discussions advanced.
Within commodities, Gold continued to rally, topping $US4300 per ounce before experiencing a pullback. Bond markets experienced minor moves as the US Federal Reserve cut interest rates by 25 basis points as expected. In Australia, the Quarterly Consumer Price Index (CPI) release dashed expectations of a rate cut decision at the Reserve Bank of Australia’s (RBA) November meeting.
Selected market returns (%)
OCTOBER 2025
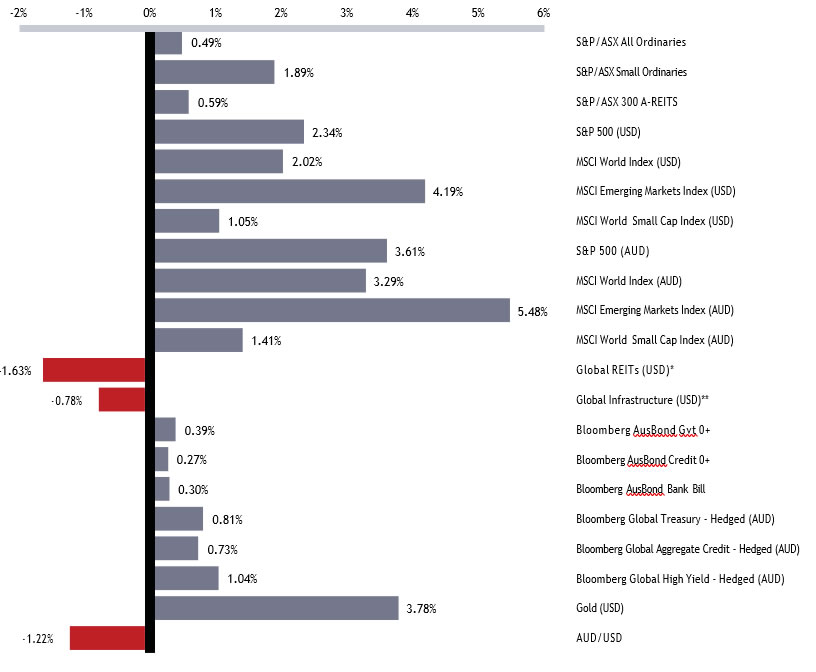
Sources: *FTSE EPRA/NAREIT DEVELOPED, **FTSE Global Core Infrastructure 50/50 Index
KEY MARKET AND ECONOMIC DEVELOPMENTS IN OCTOBER 2025
Financial markets
Global equity markets continued to deliver robust gains in October, with the MSCI World (USD) up 2.02%. Investors were encouraged by developments in trade deal discussions and solid earnings results from US companies. US Bond yields continued to trend lower on Fed easing.
Australian equities
The S&P/ASX All Ordinaries Index rose 0.49% in October, bringing the calendar year-to-date (YTD) return to 9.0%. Gains in the materials and energy sectors offset declines across
the healthcare, consumer discretionary, and information technology sectors. Geopolitical tensions helped boost both the materials and energy sectors. Materials companies reacted to discussions between Presidents Trump and Xi on rare earths, while energy companies benefited from rising oil market tensions following US sanctions on Russian oil suppliers and India’s review of its Russian oil purchases. The healthcare sector was dragged lower by CSL on an earnings downgrade and a delay
to its vaccine business spin-off.
The S&P/ASX Small Ordinaries Index finished the month up +1.89%, as the rally in the materials sector extended to smaller companies on the ASX.
Global equities
October was a positive month across global equity markets, driven by robust corporate earnings and improved investor sentiment regarding US–China trade tensions. In the US, the S&P 500 Index (+2.27% USD), Nasdaq Composite (+4.70% USD), and Russell 2000 Index (+1.76% USD) all posted gains.
US third-quarter 2025 earnings results have been robust to date, with 83% of S&P 500 companies reporting positive Earnings
Per Share (EPS) surprises. However, the magnitude of these surprises remains below long-term averages.
Emerging markets also rallied, with South Korea’s Kospi 200 Index (+20.10% USD) and Taiwan’s FTSE TW50 (+10.62% USD)
recording strong gains, supported by a new trade pact between the US and Korea and continued developments in the artificial intelligence sector.
Commodities
Gold continued to rally through October, reaching new highs and ending the month up 3.78% (USD). Prices reached record highs of $US4379 per ounce before pulling back due to a stronger US dollar and easing trade tensions.
West Texas Intermediate (WTI) crude oil fell -2.23% as investors grappled with the US blacklisting of Russia’s two largest oil producers and OPEC+ considering an output hike.
Rare earths and critical minerals emerged as
a major theme. China expanded its restrictions on rare earth exports, including products manufactured with Chinese components, intensifying global supply chain pressures.
This was reversed later in the month but still drove a surge in investor interest. In response, the US and Australia announced a $4.6 billion partnership to develop critical mineral projects, aiming to reduce reliance on China. This bolstered Australia’s rare earth sector.
Bond markets
US Treasury yields briefly traded below 4% for the first time since July but ended higher as expectations for additional rate cuts eased.
The Fed delivered a 25 basis point cut during the month, though Chair Powell emphasised that another move in December is not assured. The US 10-year government bond yield finished October at 4.1%, down 5 basis points.
Australian 10-year government bond yields were little changed, ending the month at 4.31% after dipping to 4.1% mid-month. A hotter-than- expected inflation print significantly reduced expectations of a November rate cut, while
the US–China trade deal also contributed to upward pressure on yields.
Economic developments
Australian economic data suggests no more rate cuts in 2025
Annual headline inflation rose to 3.2%, above forecasts of 3%, which marks a material upside surprise. The result sees underlying inflation remaining above the RBA’s 2-3% target band.
Further complicating the macroeconomic environment, the unemployment rate rose to 4.5% in September from a revised 4.3% in August. This highlights a softening labour market and challenges the RBA’s forecast of a stable 4.3% rate over the next two and a half years.
Economists now expect no further rate cuts in 2025. The 2026 outlook depends on whether inflation moderates again and how the unemployment rate trends.
The Fed cut the policy rate by 25 basis points
The Federal Reserve (Fed) cut interest rates by 0.25% lowering the target range to 3.75%-4.00%. This was despite headline
inflation rising to 3%. Personal Consumption Expenditures (PCE) inflation is more important to the Fed’s decisions, but the release was delayed due to the ongoing government shutdown. According to economists, the
read-through for PCE inflation is above the Fed’s target of 2%. The Fed cited increased downside risks to employment as the main reason for the further reduction in interest rates. Tension remains between the Fed’s dual mandates as inflation is still high while labour/ employment data are coming in weaker.
The Fed cooled expectations of a further cut in December. Fed Chair Powell suggested there were diverging views among members on the path of monetary policy in the short-term.
In a volatile month on the trade front, President Trump agreed to cut tariffs on Chinese imports by 10% to 47% in exchange for China resuming US soybean purchases and lifting its restrictions on rare-earth exports.
Outlook
While global growth is expected to slow moderately in the coming quarters, fiscal and monetary policy stimulus should provide support for an improving growth outlook. Global equities are entering their historically strongest period. This will likely be supported by solid earnings and corporate balance sheets and further increases in corporate spending on AI initiatives. Volatility will likely remain a characteristic as markets react to several key factors, including inflation and labour market data in both the US and Australia,
that will provide further guidance as to the trajectory of interest rates. Trade relations are also expected to continue to swing investor sentiment, particularly between the US and China. In an evolving investment climate, a flexible approach supported by sound fundamentals is essential for managing resilient portfolios.
Major market indicators
| 31-Oct-25 | 30-Sep-25 | 31-Aug-25 | Quarter change | 1 year change | |
| Interest Rates (at close of period) | |||||
| Aus 90 day Bank Bills | 3.65% | 3.58% | 3.61% | -3.0 | -76.0 |
| Aus 10yr Bond | 4.31% | 4.30% | 4.28% | +1.9 | +4.3 |
| US 90 day T Bill | 3.73% | 3.86% | 4.05% | -51.0 | -71.0 |
| US 10 yr Bond | 4.10% | 4.15% | 4.22% | -26.5 | -18.7 |
| Currency (against the AUD) | |||||
| US Dollar | 0.655 | 0.663 | 0.655 | 1.68% | -0.05% |
| British Pound | 0.498 | 0.492 | 0.484 | 2.09% | -1.85% |
| Euro | 0.566 | 0.563 | 0.560 | 0.11% | -6.49% |
| Japanese Yen | 100.83 | 97.81 | 96.20 | 4.11% | 0.91% |
| Trade-Weighted Index | 61.20 | 61.30 | 60.50 | 1.49% | -0.49% |
| Equity Markets | |||||
| Australian All Ordinaries | 0.5% | -0.5% | 3.2% | 3.1% | 12.5% |
| MSCI Australia Value (AUD) | 2.0% | -1.6% | 4.4% | 4.8% | 14.2% |
| MSCI Australia Growth (AUD) | -1.9% | -2.0% | -2.9% | -6.7% | 3.7% |
| S&P 500 (USD) | 2.3% | 3.6% | 2.0% | 8.2% | 21.5% |
| MSCI US Value (USD) | -0.9% | 1.8% | 2.8% | 3.7% | 8.8% |
| MSCI US Growth (USD) | 5.1% | 5.3% | 1.3% | 12.1% | 34.6% |
| MSCI World (USD) | 2.0% | 3.3% | 2.6% | 8.1% | 22.5% |
| Nikkei (YEN) | 16.7% | 5.9% | 4.1% | 28.6% | 36.7% |
| CSI 300 (CNY) | 0.2% | 3.3% | 10.5% | 14.4% | 22.6% |
| FTSE 100 (GBP) | 4.1% | 1.8% | 1.2% | 7.3% | 24.1% |
| DAX (EUR) | 0.3% | -0.1% | -0.7% | -0.4% | 25.6% |
| Euro 100 (EUR) | 3.1% | 4.4% | 0.6% | 8.4% | 22.3% |
| MSCI Emerging Markets (USD) | 4.2% | 7.2% | 1.5% | 13.3% | 28.7% |
| Commodities | |||||
| Iron Ore (USD) | 3.7% | -0.7% | 3.6% | 6.6% | 3.0% |
| Crude Oil WTI U$/BBL | -2.9% | -1.8% | -8.5% | -12.8% | -11.8% |
| Gold Bullion $/t oz | 3.8% | 11.4% | 4.4% | 20.7% | 45.2% |
Sources: Quilla, Refinitiv Datastream