Read the latest in finance and investment news in our Investment and Economic Snapshot for March 2022
Read the latest in finance and investment news in our monthly report:
The US Federal Reserve announced it will reduce the monthly pace of its net asset purchases (the end of Quantitative Easing) and signalled that it expects to raise interest rates (the start of Quantitative Tightening) shortly. Global bond and equity markets reacted in a volatile fashion, falling sharply on the news.
The US Dollar bucked the trend as did commodities on the back of heightened geopolitical tensions and higher energy prices.
Sources: Thomson Reuters, Bloomberg
It was a poor start to the year for financial markets with all major financial assets posting negative returns in January. Cash and commodities were the only asset classes to be spared as markets developed a nosebleed after reaching dizzy heights in 2021.
The catalyst triggering the ‘sea of red’ response was the rapid increase in US Treasury yields following the US Federal Reserve’s decision to reduce the monthly pace of its net asset purchases, as well as the Fed’s announcement that tighter monetary policy (higher cash rates) was just around the corner. Whilst these central bank actions were widely anticipated by markets, the sudden realisation that the Fed was on the cusp of ‘lift-off’ mode caught many by surprise, leading to widespread selling and rotation to more defensive pockets of the investable universe.
Global bond markets responded to the Federal Reserve’s more ‘aggressive’ tone by rapidly selling bonds, which caused prices to fall heavily and bond yields to rise. Yields on 2-year and 10-year US Treasuries ended the month 45bps and 28bps higher, respectively. This sharp ‘sell off’ of bonds was not just a US phenomenon but mirrored universally across global bond and credit markets.
A consequence of rising real bond yields is that it affects future earnings prospects for companies, which in turn means lower present values and a reduction in the price of shares. Predictably, this is precisely what happened. Growth stocks, which entered the year at all time highs, were impacted most. US stocks fell (-5.2%) with the technology heavy NASDAQ crashing (-9%). Sub sectors of the S&P500 including Consumer Discretionary (-8.2%) and Real Estate (-8.1%), which are extremely sensitive to rising bond yields, were also hit hard by the bond selloff.
The Australian share market also caught the brunt of the volatility with the All Ordinaries down (-6.6%) in January, in what was one of the worst starts to the year for Australian equities in decades. It was not all unwelcome news however, with some sectors of the equity market doing better than others, limiting the damage to a mini correction level only (i.e. less than 10%). Energy (+7.9%) was the top performing sector as surging oil and gas prices supported earnings upgrades in heavyweight energy stocks Santos and Woodside. The big miners, BHP and RIO, also benefitted from abnormally large price moves in the iron ore price, which incidentally was up an incredible +20.8%. In stark contrast to the strong performing Energy and Materials sectors this month, Information Technology (-10.1%), Heath Care (-7.0%) and Real Estate (-5.6%), in combination with other sectors, drove the market lower.
Whilst it was a bumpy ride for markets in January, Australia’s economy continues to hum along in the background. Household balance sheets are still reasonably strong. General confidence is slowly returning, as is general consumption. Labour statistics look promising, and people are finding jobs and returning to work. Wage growth is starting to move in the right direction. Inflation is noticeably on the march but still manageable, and all signs point to a moderation over the coming months as supply and demand forces start to harmonise.
Looking ahead, while economic growth will slow later this year courtesy of rising rates, stronger demand from households and businesses and a rotation from demand for goods to services, should keep the economic recovery alive for a while longer. If recovery continues as expected, it would be a net positive for corporate earnings and equity prices over the next 6-12 months. That said, we expect further volatility this year as markets grapple with the uncertainty posed by higher interest rates, learning to live with the virus, a slowing China, upcoming elections and rising geopolitical risks.
Source: Quilla, Thomson Reuters Datastream
In this paper we aim to explain our expectations for inflation, our views on when central banks will adjust rates and the implications of these on equity and bond markets.
What is inflation and when can it be a problem?
Inflation refers to the sustained increase in the price of goods and services. Broadly, it is quantified by measuring the change in prices for a basket of goods and services – which is known as the all-familiar Consumer Price Index (“CPI”).
Inflation occurs when economic activity is increasing and there is a mismatch in demand and supply, thereby resulting in price increases. This can be driven from the supply side (known as “cost-push”) or from the demand side (known as “demand-pull”). Left unchecked, inflation can be detrimental as it erodes the purchasing power of money and diminishes the real returns of invested assets, resulting in a host of negative flow-on impacts to both consumers and governments alike.
However, inflation is not inherently always an issue. When inflation is increasing at reasonable levels, most central bank’s target an annual inflation range between 2-3% p.a, it signals a growing economy which is beneficial for all market participants. It is only when inflation rises too far above these “healthy” levels that the erosion of the consumer’s purchasing power (and its corresponding effects) outweighs the benefits flowing from the economic expansion.
(a) Short-term inflation expectations
Headline inflation indicators (like CPI) will likely spike over the next few releases, as the base effects of the abnormally low inflation data from a year ago falls out of annual calculations. Keep in in mind that annual CPI is the aggregate of monthly inflation over the previous 12 months, so when especially low numbers drop out and are replaced by stronger monthly numbers, then annual inflation will rise – this is what we mean by ‘base effects. Another factor likely to add to inflationary pressures are supply constraints, an example of this issue can be found in the global production and supply of semi-conductors which are a key component for products that contain computer chips. As a result of production shutdowns caused by COVID-19, supply was dramatically reduced and is only now slowly returning to normal. The impacts of this have been felt far and wide, with everything from cars to farm machinery seeing production shortages. We expect these issues to be resolved over coming months and therefore they should only have a transitory impact on prices. In turn, these issues create uncertainty in bond markets as the prospect of rising prices (and by extension, inflation) increases the likelihood of central banks raising interest rates to prevent the economy from overheating. However, we expect the current inflationary climate to be temporary and unlikely to result in inflation remaining above central bank targets in the immediate future.
A key macroeconomic indicator for investors to watch is the Output Gap (refer to Appendix 1) which represents the capacity utilisation of an economy. When this measure is negative, it indicates spare capacity and inflation is unlikely to be an imminent problem. Currently, the output gap in the US is -1.59% and this is mirrored in most developed nations, including Australia, as they continue to feel the effects of COVID-19. As a result, we believe it will be some time before the Output Gap narrows and causes inflation to remain above central bank’s targets.
When will inflation become an issue?
(a) US
The Congressional Budget Office (CBO) forecasts the output gap for the US, which the US Federal Reserve (“FED”) uses as an input to monetary policy decisions. The CBO’s most recent projection (Figure 1 below) suggests they do not see an imminent threat to markets from excessive inflation.
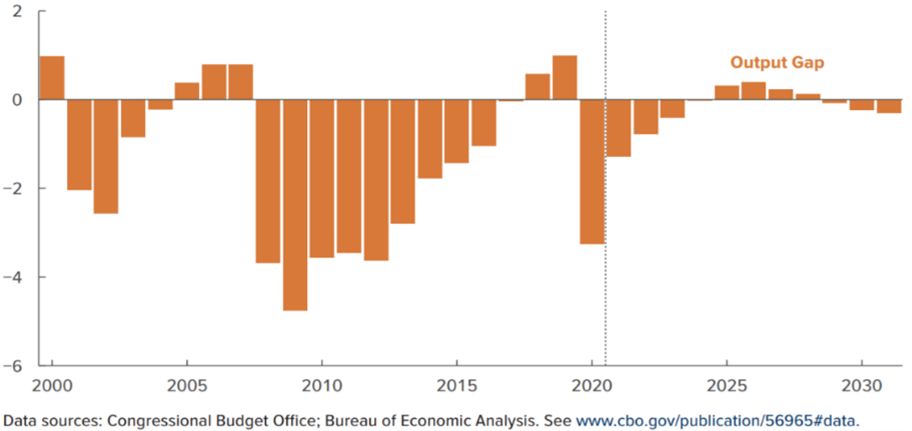
Figure 1 – US Output Gap
Whilst the CBO does not see inflation being an issue for several years it is important to highlight several variables that could significantly impact this forecast.
The first variable that could impact how quickly the output gap closes is the size and structure of US fiscal policy implemented as a result of the COVID-19 pandemic. One key policy was the infrastructure stimulus package handed down by President Biden (Democratic party) in March 2021. Given the package has not yet been signed into law, the CBO did not include this in their most recent forecast. It is expected this package will accelerate actual GDP faster than the CBO’s forecast. The increase in government bond yields over the last 12 months would suggest the market supports these views.
Another key variable that could result in inflation becoming an issue faster than the current estimate is the speed at which the US labour market recovers. Currently the unemployment rate in the US is still above pre-COVID-19 levels. However, given the recent upgrades in the outlook for economic growth and the reopening of service-oriented industries that suffered during the pandemic, we expect unemployment to gradually return to more normal levels but anticipate periods of volatility along the way.
Furthermore, although we have recently seen tightening in the labour market as demand outstrips supply, we believe this will pass as government unemployment benefits roll off and remaining COVID-19 restrictions are lifted. As a result, we are likely to see more people re-entering the work force which in turn will drive up the participation rate and offset the current labour shortage. We expect overall levels of unemployment to improve but do not anticipate that the labour market will tighten to a level where we will see significant wage inflation over the short to medium term.
Recently there has also been some focus on spikes in the cost of production. While there is evidence that there has been a surge in the cost of production, it is our view, and that of central banks around the world, that the supply constraints causing these price rises will also be temporary. Once economies reopen and return to full capacity these supply constraints will subside. A key indicator used to measure the cost of production is the Producer Price Index (“PPI”) which tracks the change in prices received by producers. It is worth noting that the rising cost of production (PPI) does not automatically translate into increased inflation (Core CPI), as we can see from the chart (Figure 2 below).
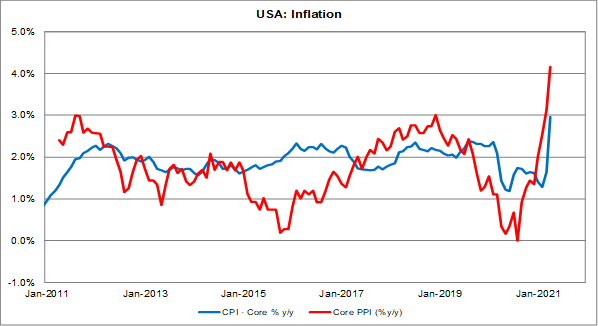
Figure 2 – Inflation vs PPI (Annual)
Taking these facts into consideration, we are adopting a ‘middle ground’ view. Whilst we do not fully agree with the CBO and FED’s view that inflation will remain subdued for several years, we are also not convinced it is an immediate issue. As such, we anticipate inflation in the US is likely to become an issue somewhere around mid-2022.
(b) Australia
The same underlying outlook applies to the Australian economy. Similar to the US, we do not believe that inflation is an imminent issue and that the trajectory of inflation in Australia is likely to be more modest than the US.
The current output gap in Australia (see Figure 3) suggests inflation will be a little over 1% at the end of 2021 and will steadily rise to 1.5% through 2022 and 1.75% by mid-2023. Based on this forecast, Australia will still be sitting below the RBA’s CPI target of 2% at the end of 2023.
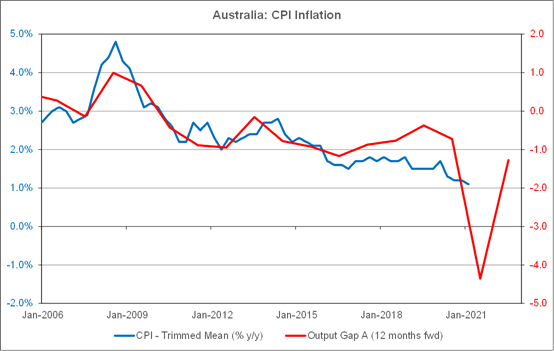
Figure 3 – CPI vs Output Gap
This forecast aligns with the current market consensus which suggests the output gap in Australia will reduce at a slower rate than the US output gap. Unlike the US, the Australian government has implemented more moderate fiscal spending packages. However, given the cyclical nature of the Australian economy, as growth momentum builds globally, we anticipate the output gap will close and therefore likely accelerate inflation faster than current expectations.
When will central banks start to increase interest rates?
Prior to the COVID-19 outbreak, a number of central banks modified their framework for determining when they adjust interest rates. In the US for example, previously the FED had utilised hundreds of internal models and experts to forecast inflation and would determine changes to the cash rate based on this information. Recently there has been a shift in methodology which resulted in two major modifications to the process. The first is that instead of relying solely on inflation forecasts they now use a combination of forecasts and actual inflation data. The second is that instead of automatically reacting when inflation moves significantly away from target, they are now willing to accept periods of higher or lower inflation so long as the average level of inflation remains at the bank’s target level of 2% over the medium term. The implications of these changes suggest that there would need to be a prolonged period of realised inflation/deflation above or below the 2% target inflation level to necessitate a response from the FED. These changes are designed to remove the likelihood of data spikes distorting forecasts which could result in an unnecessary change to the cash rate, much like what happened after the Global Financial Crisis (“GFC”).
Current expectations by the Australian and US central banks have indicated that they do not intend to tighten monetary policy (i.e., increase rates) until 2023/24. Managing the cash rate is a balancing act – while the banks want to provide an accommodative environment to allow the economy to recover, they do not want to let inflation get out of hand. But given the recent changes in policy as well as the lessons learnt during the GFC when cash rates were raised too quickly, it seems likely that the central banks will take a more conservative approach and will allow inflation to run more than they previously would have tolerated. That said, whilst we do not expect cash rates to change in the next 12 months, we do anticipate they will increase sooner than central banks’ current time frames.
Our analysis suggests that inflation is unlikely to become an issue in the US until the second half of 2022, and mid-2023 in Australia. As such, we expect the FED, and the RBA will begin to raise rates around the same time.
What will rising rates mean for equities?
The impact of rising interest rates and inflation more generally will affect equity markets differently depending on the country, sector, or style of the underlying stocks. A key factor to watch will be the current valuation of the asset relative to its value historically. It is likely that assets that have significantly outperformed and sit well above their historic valuations will be most affected by a rise in interest rates.
(a) Equity valuations
The majority of global equity markets experienced a strong rebound in returns following the COVID-19 drawdown in February and March 2020, but some markets have recovered faster than others (see Figure 4 below). In some instances, valuations have surpassed their pre-COVID-19 levels and made new historic highs.
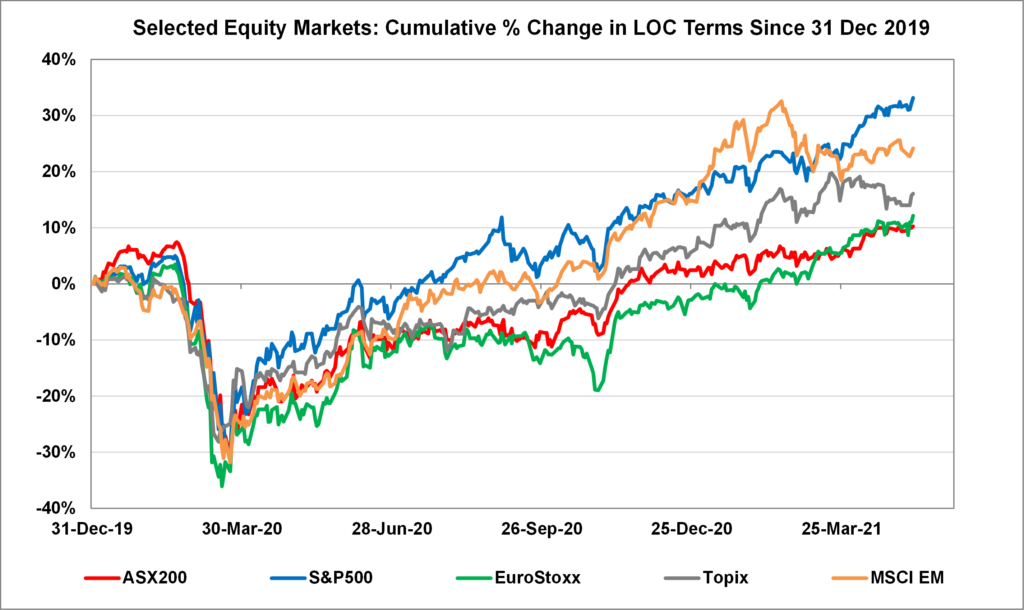
Figure 4 – Cumulative % Change in Equity Markets
In the US, for example, the S&P500’s current Price to Earnings ratio is 23.5x, 17.5% above its pre-COVID-19 levels and 38% above its long-term average. On the other hand, several other developed markets like Australia, Europe, and Japan have not recovered as much and on a relative valuation basis look more attractive for investors.
Whilst we expect rising rates to be a headwind for equity markets (as the prospect of rising rates increases the cost of capital and reduces future earnings), we anticipate countries with elevated valuations, like the US, will be impacted more than markets that have seen more modest recoveries.
Similarly, at the sector level, some sectors have recovered faster than others following the COVID-19 drawdowns in early 2020. Sectors like Information Technology, Healthcare, and Consumer Discretionary have benefited from COVID-19 restrictions, recovering rapidly, and reaching new highs after their initial drawdown. However, this is not the case for all sectors, with Property, Infrastructure, and Resources lagging the market through 2020. When central banks inevitably do increase interest rates, the market’s reaction will differ depending on the relative valuation levels of the sector. Our view is that those sectors that do not have excessive valuations will endure the effect of rising rates considerably better than those that have historically high valuations.
What is also evident is that the sectors that underperformed during the COVID-19 recovery are the segments of the market that will likely benefit when economic growth is stronger (pro-cyclical). Along with having more modest valuations, we believe these sectors will benefit from the more positive economic growth outlook, further insulating their future returns from the impact of rising interest rates.
(b) Growth or Value Investing?
There has been much discussion around the relative performance of growth vs value, with growth stocks outperforming value stocks over the past 10 years. It is not unusual for one style to outperform another however, these deviations normally mean revert over the long term.
Growth stock performance is typically negatively correlated to interest rates which has been one of the major drivers of the outperformance of the growth style over value over recent years. Due to the way growth-style companies’ earnings and valuations are calculated, these assets have an inverse relationship with interest rates, so when central banks eventually increase interest rates, it will drag down the future earnings and valuations of these stocks.
The disparity in performance of growth and value stocks only increased during the COVID-19 recovery with growth stocks benefiting from lockdowns and a subdued economic outlook, which intensified expectations that interest rates would remain low and accommodative. This supportive environment resulted in growth assets quickly returning to extremely elevated valuations and, in some cases, passing historic highs. This only increases growth stocks sensitivity to a rise in future interest rates.
Although we have seen signals that value stocks are starting to benefit from economies reopening and the positive economic outlook, on a relative basis, the valuations for these stocks are still well behind growth stocks. As such, we do not believe the impact of rising interest rates will be as significant for these stocks. In addition, the value universe is comprised of mainly pro-cyclical companies that benefit from the global growth narrative.
In summary, assets that are more closely tied to the global recovery (value stocks) will be less sensitive to an interest rate rise. Whilst we have seen the early signs of a rotation back to value/cyclical style stocks, given the scale of the underperformance of these stocks over the last 10 years, we believe there is still some way to go in this trade.
What will rising inflation and interest rates mean for fixed income markets?
Rising rates due to higher inflation are likely to be a headwind for fixed income markets given the sensitivity of fixed income assets to changes in interest rates. Most bonds pay a fixed coupon that becomes more attractive if interest rates fall. The calculation of the annual coupon as a percentage of the bond price is known as “yield”.
As interest rates rise, the price of the fixed-coupon bond falls (inverse relationship) as newer bonds issued at the prevailing higher interest rate are more attractive to investors. The price of the bond falls to compensate the investor for the opportunity cost of not investing in these newly issued bonds paying higher coupons. As a result, we anticipate fixed-income assets may struggle in an environment when inflation and interest rates are increasing.
However, much like equities, the magnitude of these impacts will differ from bond to bond. Broadly, bonds’ sensitivity to interest rates is measured by a metric known as modified duration (“duration”) – the longer the duration of a bond, the higher the sensitivity to rising interest rates. A number of factors will impact the duration of a bond. The most significant factors are the length of time to maturity and the coupon rate. The greater the length of time until maturity and the lower the coupon, the longer the duration. In a market where inflation is rising and central banks are increasing interest rates, fixed coupon paying bonds that have shorter duration will be less impacted than those with a longer duration.
Along with duration, another factor that will determine how fixed-income assets perform is its underlying category – for most bonds this is whether it is a government or corporate issued bond. The key difference between these two classes of bonds is in their credit quality. In general, corporate bonds will offer higher yields to compensate the investor for taking on additional credit risk. In contrast, government bonds – for the most part – are used as a proxy for risk-free assets as governments will always be able to print money to service existing debt obligations. Credit quality is affected by many things, including the state of the economy, a company’s performance, and its debt burden.
In an environment where economic growth is strong, it is likely that most companies’ credit quality will improve. However there comes a point with any asset, where future expectations are already priced into the asset value, which can then result in a period of stagnate returns. We believe this point has been reached with corporate bonds, as improving growth expectations have already seen strong performance from these assets over the previous 12 months.
The Output Gap
The Output Gap is the most widely accepted leading indicator on the trajectory of inflation and is a major input into the central banks’ decision-making process. The Output Gap is defined as the difference between actual and potential GDP. The simplest way to think of potential GDP is the output of an economy if it was operating at full capacity, while actual GDP is the level of output the economy truly produced.
In a climate where potential GDP is greater than actual GDP there is excess capacity in the economy and as a result there is no supply or demand pressure pushing or pulling prices up. However, when actual GDP is greater than potential GDP this suggests that the economy is operating above its capacity which in turn creates constraints particularly among businesses as they compete for the same resources and labour. This competition puts upward pressure on wages and other associated inputs, resulting in prices rising (inflation). Typically, we would expect to see 12-18 months of actual GDP outstripping potential GDP before these capacity constraints start impacting prices.
New Covid-19 variant Omicron rattles financial markets
Australia’s quarterly GDP result comes in better than expected
US Federal Reserve Chairman, Jerome Powell signals bringing forward the timetable for accelerated tapering and concedes that inflation could be higher for longer.
Sources: Thomson Reuters, Bloomberg
Financial markets contracted in the final days of the month after the discovery of a more transmissible Covid-19 variant called Omicron reached Australian shores. The volatility index shot higher as market fears took hold, resulting in intense selling pressure of risk assets in the final days of the month both here and abroad.
Emerging markets (EM) were one of the hardest hit sectors, falling over 4% courtesy of a continued slowdown and energy crisis in China, heightened concerns about inflation and the uncertainty posed by Omicron to EM given relatively low vaccination rates compared to more developed economies.
Elsewhere, the dominos continued to shake and fall. An increase in Covid-19 cases in Europe and the reintroduction of lockdowns there dampened the global mood. The Aussie market fell in sympathy but outperformed global shares this month. Defensive sectors such as Telecommunications, Consumer Staples, Real Estate and Utilities were well supported, all benefitting from a decline in global bond yields. Energy on the other hand, was the worst performing sector with a decline of -6.7% on the back of falling oil prices and the Omicron variant. The Australian Dollar fell from 75c to 71c reflecting falling commodity prices, widening interest rate differentials and a general market preference for safe-haven currencies during this recent bout of volatility.
On the economic front, key third quarter statistics including Gross Domestic Product (GDP), consumption, investment income and savings were released. There were no major surprises other than that the results were not as weak as originally feared. GDP fell 1.9% reflecting reduced activity due to extended lockdowns across NSW, Victoria, and the ACT. Private demand was down, driven by a fall in household consumption. Exports of mining and rural commodities rose, reflecting increased global demand for coal, LNG, and meat products. Imports of goods fell, reflecting the reality of continued global supply constraints and a broad-based fall in domestic demand.
The domestic household savings ratio jumped noticeably from 11.8% to 19.8% in the September quarter. This was driven by increased household income coupled with a general decline in spending. Overall, these National Accounts results were better than many economists were expecting. One positive development that can be gleaned from the data is that greater savings plus the wealth effect from appreciating assets, now provides the population with a financial buffer to turn to if economic conditions were to deteriorate in the year ahead. It also offers consumers the wherewithal to spend once current caution is thrown to the wind and confidence returns.
On the subject of inflation, which has been getting plenty of attention by the financial press recently, the Reserve Bank of Australia (RBA) continued to reiterate that underlying inflation is expected to be around 2.25% by the end of 2022 and around 2.5% by the end of 2023. Headline inflation, however, was expected to run above underlying inflation in the near term largely owing to the sharp rise in fuel prices before stabilising. This may already be playing out. Whilst wage growth is subdued, the prospect of monetary policy tightening and a policy mistake by going too hard too early, would appear to be unlikely in the year ahead given the RBA’s view that wage growth is going to take some time to manifest itself.
In the US, progress on vaccinations, indicators of economic activity and employment have continued to strengthen much like they have in Australia and elsewhere in the world. Inflation remains elevated, however. The cost of goods and services in October jumped 6.2% over the past year, with food prices up 5.3% over the last year and energy rising an astronomical 49%. Interestingly, Federal Reserve Chair, Jerome Powell has gone on the record recently suggesting that higher inflation is likely to persist for longer than the Fed originally thought. This remark marks a departure from the central bank’s long held view (and that of the RBA) that inflation would start to ease once supply chain challenges are resolved. This pivot clears the way for accelerated tapering and ultimately tighter monetary policy which some market commentators forecast to happen towards the end of next year if not sooner. More will be revealed at the December Federal Reserve meeting. In the meantime, markets will be fixated on the Fed’s response to the changing environment, including the potential threat of Omicron. The stage is set for a fascinating year ahead.
30-Nov-21 | 31-Oct-21 | 30-Sep-21 | Qtr change | 1 year change | |||||||
Interest Rates (at close of period) | |||||||||||
Aus 90-day Bank Bills | 0.04% | 0.04% | 0.01% | +3.0 | +2.0 | ||||||
Aus 10yr Bond | 1.81% | 1.72% | 1.28% | +69.0 | +94.0 | ||||||
US 90-day T Bill | 0.05% | 0.05% | 0.04% | +1.0 | -3.0 | ||||||
US 10 yr Bond | 1.44% | 1.56% | 1.53% | +13.9 | +59.9 | ||||||
Currency (against the AUD) | |||||||||||
US Dollar | 0.709 | 0.751 | 0.722 | -2.98% | -3.77% | ||||||
British Pound | 0.536 | 0.547 | 0.536 | 0.88% | -3.25% | ||||||
Euro | 0.632 | 0.647 | 0.622 | 1.97% | 2.36% | ||||||
Japanese Yen | 80.70 | 85.74 | 80.51 | 0.29% | 5.31% | ||||||
Trade-Weighted Index | 60.20 | 63.10 | 60.80 | -1.63% | -2.11% | ||||||
Equity Markets | |||||||||||
Australian All Ordinaries | -0.3% | 0.1% | -1.6% | -1.8% | 16.7% | ||||||
MSCI Australia Value (AUD) | -2.6% | -0.2% | -1.0% | -3.7% | 15.6% | ||||||
MSCI Australia Growth (AUD) | 1.9% | 0.8% | -3.0% | -0.3% | 14.3% | ||||||
S&P 500 (USD) | -0.7% | 7.0% | -4.7% | 1.3% | 27.9% | ||||||
MSCI US Value (USD) | -2.7% | 5.7% | -3.6% | -0.9% | 22.9% | ||||||
MSCI US Growth (USD) | 0.6% | 8.2% | -5.7% | 2.5% | 31.1% | ||||||
MSCI World (USD) | -2.2% | 5.7% | -4.1% | -0.8% | 22.3% | ||||||
Nikkei (YEN) | -3.7% | -1.9% | 5.5% | -0.3% | 7.0% | ||||||
CSI 300 (CNY) | -1.6% | 1.0% | 1.3% | 0.7% | -0.8% | ||||||
FTSE 100 (GBP) | -2.2% | 2.2% | -0.2% | -0.2% | 16.8% | ||||||
DAX (EUR) | -3.8% | 2.8% | -3.6% | -4.6% | 13.6% | ||||||
Euro 100 (EUR) | -3.1% | 5.4% | -2.4% | -0.3% | 22.0% | ||||||
MSCI Emerging Markets (USD) | -4.1% | 1.0% | -3.9% | -6.9% | 3.0% | ||||||
Commodities | |||||||||||
Iron Ore (USD) | -6.6% | -4.6% | -25.2% | -33.4% | -19.8% | ||||||
Crude Oil WTI U$/BBL | -20.8% | 11.2% | 9.6% | -3.5% | 46.0% | ||||||
Gold Bullion $/t oz | 0.2% | 0.9% | -2.5% | -1.5% | 0.3% | ||||||
Source: Quilla, Thomson Reuters Datastream
Global economic activity continued to stabilise.
Inflation surprises on the upside.
Bond markets continue to fall in response to global inflationary pressures and market expectations of accelerated central bank tightening.
Global equities bounce back following a volatile September.
Sources: Thomson Reuters, Bloomberg
Throughout the month, further evidence surfaced suggesting that Australia’s economic recovery is on track and is quickly gaining momentum. Investor and consumer confidence continued to rise, buoyed by promising vaccine statistics, and a gradual easing of lockdown restrictions. Many firms are now hiring, and employment is expected to pick up strongly over the coming months.
The Reserve Bank of Australia (RBA) is currently forecasting economic growth of 3% over the remainder of the year, followed by a healthy 5½% throughout 2022. Unemployment levels are expected to drop from 4½% to closer to 4% by the end of 2023 which augurs well for wage growth (currently 1.7%) as the labour market gradually tightens over the next 1-2 years.
Global inflation however has picked up noticeably and rapidly in the US (5.4% year on year) and in Australia (3.0%). At 3.0%, inflation is currently sitting right at the upper bound of the RBA’s target band. This development has taken the RBA somewhat by surprise, but they consider the uplift in inflation to be largely attributable to disruptions to the global supply chains borne out of the pandemic and accentuated by higher oil prices and rising transport costs, all of which are assumed to be temporary by nature. The RBA’s base case expectation is that inflation, whilst currently higher than expected, is unlikely to stay high once supply chain bottlenecks resolve themselves over time.
Interestingly, central banks such as New Zealand, Norway and South Korea are thinking differently and are not as patient as the US and Australia. These central banks have recently raised official interest rates which suggests that they consider inflationary pressures to be more persistent. For example, New Zealand increased their official cash rate from 0.25% to 0.5% last month.
Other developed economies are recognising the risks of higher inflation but are choosing for the moment to reduce and or remove other stimulus measures rather than raise rates. The Bank of Canada ended its quantitative easing programme in October and has flagged that monetary policy support could potentially be eased ‘sometime in the middle quarters of 2022’ once their inflation target is achieved. The US Federal Reserve has also communicated that it will begin to taper asset purchases from mid-November in recognition that substantial gains towards their goals have been achieved.
For the time being, the RBA continues to maintain that the Australian economy is not overheating. Sustainable inflation, full employment and wage growth are not in evidence just yet. That said, the RBA’s recent monetary policy meeting announcement speaks volumes that they are hedging their bets and leaving the door ajar for an earlier monetary policy response if circumstances force their hand. This opinion is based on the RBA’s November decision to discontinue their target of 10 basis points for the April 2024 Australian Government bond which suggests that in the absence now of a stated timeline, rates could potentially rise a lot earlier than first thought. In fact, the Board noted that the decision to end the yield target was driven by “improvement in the economy and the earlier-than-expected progress towards the inflation target”. In addition, the Board noted that since the market expected higher inflation, the “effectiveness of the yield target in holding down the general structure of interest rates in Australia has diminished”. This is quite a development and a shift in narrative for the RBA which raises the likelihood of a rate rise sooner than later.
We are watching this development with interest given the wider implications the prospects of higher inflation and tighter monetary policy has on the end consumer, future returns on investment and Australia’s international competitiveness. It is a fascinating yet complex dynamic.
As far as financial markets were concerned, October proved to be a better month for global equities following a relatively weak and volatile September quarter. US Equities led the way posting an impressive 7% return for the month with Energy, Materials, and Information Technology the major contributors. Australian equities finished the month just above water at 0.2%, held back by underperforming Telecommunications, Healthcare, and Industrial sectors.
On the other hand, Bond market returns continued to fall as yields rose in response to global inflationary pressures and a growing expectation that central banks will bring forward the timetable for raising interest rates as described in this update.
Also catching attention this month were commodity markets. Iron ore, Australia’s largest export, fell a further -4.6% after plummeting over -25% in September. Conversely, surging demand for oil and a worldwide shortage of supply saw the oil price rise by 11% in October and appreciate a staggering 135% over the past year.
31-Oct-21 | 30-Sep-21 | 31-Aug-21 | Qtr change | 1 year change | ||||||
Interest Rates (at close of period) | ||||||||||
Aus 90 day Bank Bills | 0.04% | 0.01% | 0.01% | +2.0 | -3.0 | |||||
Aus 10yr Bond | 1.72% | 1.28% | 1.12% | +47.0 | +90.0 | |||||
US 90 day T Bill | 0.05% | 0.04% | 0.04% | -1.0 | -4.0 | |||||
US 10 yr Bond | 1.56% | 1.53% | 1.30% | +31.7 | +69.7 | |||||
Currency (against the AUD) | ||||||||||
US Dollar | 0.751 | 0.722 | 0.731 | 2.18% | 6.96% | |||||
British Pound | 0.547 | 0.536 | 0.532 | 3.34% | 0.35% | |||||
Euro | 0.647 | 0.622 | 0.620 | 4.12% | 7.28% | |||||
Japanese Yen | 85.74 | 80.51 | 80.47 | 6.50% | 16.49% | |||||
Trade-Weighted Index | 63.10 | 60.80 | 61.20 | 2.44% | 6.05% | |||||
Equity Markets | ||||||||||
Australian All Ordinaries | 0.1% | -1.6% | 2.6% | 1.1% | 29.0% | |||||
MSCI Australia Value (AUD) | -0.2% | -1.0% | 1.6% | 0.4% | 36.3% | |||||
MSCI Australia Growth (AUD) | 0.8% | -3.0% | 4.4% | 2.0% | 16.7% | |||||
S&P 500 (USD) | 7.0% | -4.7% | 3.0% | 5.1% | 42.9% | |||||
MSCI US Value (USD) | 5.7% | -3.6% | 2.0% | 3.9% | 42.7% | |||||
MSCI US Growth (USD) | 8.2% | -5.7% | 3.9% | 5.9% | 43.9% | |||||
MSCI World (USD) | 5.7% | -4.1% | 2.5% | 3.9% | 41.0% | |||||
Nikkei (YEN) | -1.9% | 5.5% | 3.0% | 6.6% | 27.8% | |||||
CSI 300 (CNY) | 1.0% | 1.3% | 0.1% | 2.4% | 6.5% | |||||
FTSE 100 (GBP) | 2.2% | -0.2% | 2.1% | 4.1% | 34.5% | |||||
DAX (EUR) | 2.8% | -3.6% | 1.9% | 0.9% | 35.8% | |||||
Euro 100 (EUR) | 5.4% | -2.4% | 2.3% | 5.2% | 47.3% | |||||
MSCI Emerging Markets (USD) | 1.0% | -3.9% | 2.6% | -0.4% | 17.3% | |||||
Commodities | ||||||||||
Iron Ore (USD) | -4.6% | -25.2% | -14.3% | -38.9% | -4.6% | |||||
Crude Oil WTI U$/BBL | 11.2% | 9.6% | -7.2% | 13.0% | 134.7% | |||||
Gold Bullion $/t oz | 0.9% | -2.5% | -0.9% | -2.5% | -5.5% | |||||
Source: Quilla, Thomson Reuters Datastream
The big news for markets in September was the announcement by the FED that their tapering program would begin around the end of the year.
This pushed real yields higher by around 20bps and sent the US 10-year government bond yield towards 1.50%. Here in Australia, the Reserve Bank of Australia (RBA) was a little more dovish due to the continued impact from lock-downs, stating they would delay the review of the current bond purchase program until their February 1 2022 meeting. As a result, our 10-year bond yields rose, but at a slower pace than US, finishing the month up 14bps. The RBA’s targets of 4% unemployment and 2.5% underlying inflation look like they will be achieved around the middle of 2022, with the speed of future tapering closely linked to progress towards these goals.
These significant movements in bond yields negatively impacted the performance of assets sensitive to interest rates. Long duration bonds recorded a negative month and growth stocks tendered to under-perform shorter duration value stocks. Globally, the Australian stock market was one of the better performers, beating the US, European and Emerging markets. This was, in part, due to our heavier exposure to energy related stocks that were supported by stronger prices from key commodities such as coal, gas and oil.
The AUD/USD exchange rate was a little weaker over the month. Concerns about the collapse of the Evergrande Group and the associated impact on iron ore demand by the Chinese construction sector pushed our currency back down to US$0.72.
Sources: Thomson Reuters, Bloomberg
In September, global growth continued to be impacted by the third wave of Covid-19. In particular, Australia, China and Japan struggled to maintain positive growth as a result of shutdowns to limit the spread of the virus. Lead indicators of industrial production suggest that Q3 growth may be negative, although we anticipate this will quickly rebound towards the end of the year as economies are re-opened and the vast reserves of household savings are deployed into the market. Offsetting this will be the gradual withdrawal of policies designed to support growth, this includes the well telegraphed tapering of central bank bond purchases, as well as the normalisation of big fiscal spending programs.
The other key theme that drew investors’ attention in September was the evolving potential for a debt default by the Chinese Evergrande Group. The Chinese Government’s appetite to bail out the struggling construction conglomerate seems to be lower than in previous years as their focus turns more to implementing social policies designed to improve housing affordability. It seems likely the company may be forced to divest business lines in an attempt to reduce debt and meet their future payment obligations. Chinese non-manufacturing PMIs in September rose back to 53.2, above the key 50 mark that indicates an expansion. This suggests the Evergrande problems might be contained, and broader Chinese growth may be in for a soft landing. However, more important for the wider Chinese economy are power outages and electricity rationing as a result of coal stockpiles falling to 10-year lows. Given this is occurring at the same time as surging export orders, growth may be inhibited which would result in consumer price increases.
In the US, the big news is that the gradual normalisation of bond yields has started. September saw big increases in real yields, which helped to reduce or remove some of the significant mispricing in key markets. Key to the pace of tightening will be employment data and the flow on impact to wage inflation. At the moment, shortages in labour have been most keenly felt in sectors rapidly rebounding from Covid-19 induced lockdowns. Participation rate data suggests workers have been happier on unemployment benefits rather than returning to work. However, these benefits have now ended, and we anticipate supply to improve in coming months. This will likely see the improvement in US unemployment stall before beginning to improve again next year.
Also in the US, the Biden administration recently hit a political hurdle to the implementation of their fiscal stimulus plans. The US debt ceiling negotiations once again appear to be keeping markets on edge – a last minute deal in late September between the Democrats and Republications extended the deadline for agreement to 18 October 2021. Agreement on this matter is critical as it is needed to fund round two of President Biden’s infrastructure spending plan. Importantly, this stimulus is already priced into markets whereas the risk of a debt default is not. This presents a near term risk to confidence and to equity markets.
In Australia the full impact of the Covid-19 lockdowns is yet to be felt. Although, at the moment, markets seem less concerned about the impact of the widely anticipated negative growth in Q3 and more focused on reacting to international matters. Unemployment continued its downward trend, with August numbers released in mid-September showing an improvement to 4.5%, albeit this was off a lower participation rate. We anticipate this will reverse in coming months as the lengthy business shutdowns in New South Wales and Victoria have forced people out of work. The underemployment rate deteriorated from 8.3% in July to 9.3% in August, highlighting there is still significant spare capacity in our economy to absorb a strong rebound, thereby limiting the near-term potential for inflation above the RBA target band.
Given all this, valuations in the Australian equity market fell during September, albeit less than other major markets globally. Our market ended the month down (-1.6%) whereas the US market was pulled down further (-4.7%), with the materials and industrials sectors falling more than 5%. Stocks with longer duration cashflows and elevated valuations will remain under-pressure, this includes technology and utility stocks. However, other sectors and stocks that present better valuation metrics and that are more geared to shorter term market cycles are poised to outperform
The AUD experienced small declines against the USD, pulled down by iron ore which fell heavily during the month. From a technical perspective, short AUD positions are at extreme levels. As a result, we anticipate some support for our dollar, perhaps pushing closer to the mid-seventies over coming months.
Bond investors also faced losses this month, especially longer-term bond holders that were buffeted by the rise in bonds yields. We anticipate this trend to continue, so reducing term exposure in bonds remains an important way to mitigate this risk.
| 30-Sep-21 | 31-Aug-21 | 31-Jul-21 | Qtr change | 1 year change |
Interest Rates (at close of period) | | | | | |
Aus 90 day Bank Bills | 0.01% | 0.01% | 0.02% | -2.0 | -8.0 |
Aus 10yr Bond | 1.26% | 1.12% | 1.25% | -26.0 | +36.0 |
US 90 day T Bill | 0.04% | 0.04% | 0.06% | -1.0 | -6.0 |
US 10yr Bond | 1.53% | 1.30% | 1.24% | +8.3 | +85.0 |
Currency (against the AUD) | | | | | |
US Dollar | 0.722 | 0.731 | 0.735 | -3.78% | 0.78% |
British Pound | 0.536 | 0.532 | 0.530 | -1.25% | -3.20% |
Euro | 0.622 | 0.620 | 0.621 | -1.66% | 2.59% |
Japanese Yen | 80.51 | 80.47 | 80.50 | -3.38% | 6.56% |
Trade-Weighted Index | 60.80 | 61.20 | 61.60 | -3.03% | 0.16% |
Equity Markets | | | | | |
Australian All Ordinaries | -1.6% | 2.6% | 1.1% | 2.0% | 31.5% |
MSCI Australia Value (AUD) | -1.0% | 1.6% | 0.3% | 0.9% | 40.9% |
MSCI Australia Growth (AUD) | -3.0% | 4.4% | 1.2% | 2.4% | 17.0% |
S&P 500 (USD) | -4.7% | 3.0% | 2.4% | 0.6% | 30.0% |
MSCI US Value (USD) | -3.6% | 2.0% | 1.2% | -0.6% | 32.0% |
MSCI US Growth (USD) | -5.7% | 3.9% | 3.5% | 1.4% | 29.1% |
MSCI World (USD) | -4.1% | 2.5% | 1.8% | 0.1% | 29.4% |
Nikkei (YEN) | 5.5% | 3.0% | -5.2% | 3.0% | 29.1% |
CSI 300 (CNY) | 1.3% | 0.1% | -7.3% | -6.0% | 8.0% |
FTSE 100 (GBP) | -0.2% | 2.1% | 0.1% | 2.0% | 25.4% |
DAX (EUR) | -3.6% | 1.9% | 0.1% | -1.7% | 19.6% |
Euro 100 (EUR) | -2.4% | 2.3% | 1.3% | 1.2% | 35.7% |
MSCI Emerging Markets (USD) | -3.9% | 2.6% | -6.7% | -8.0% | 18.6% |
Commodities | | | | | |
Iron Ore (USD) | -25.2% | -14.3% | -14.2% | -45.0% | -1.7% |
Crude Oil WTI U$/BBL | 9.6% | -7.2% | 0.4% | 2.1% | 87.6% |
Gold Bullion $/t oz | -2.5% | -0.9% | 3.3% | -0.3% | -7.3% |
Source: Quilla, Thomson Reuters Datastream | | | | | |
August saw more of the same themes and risks that global financial markets had focused on in July.
Covid-19 continued to spread around the world, leading to further slowing of economic activity, disruptions to global supply chains, and pockets of inflationary pressures. Despite a weaker domestic economic outlook for the September quarter, the Reserve Bank of Australia (RBA) decided to reduce its purchases of government securities by $1 billion a week from early September to a rate of $4 billion a week until at least mid-November. The RBA also said it will not increase the cash rate until inflation is sustainably within the 2 to 3 per cent target range and that it does not expect that to happen before 2024. Importantly, the Board separated tapering its bond purchases from when it would lift the cash rate. In the US, the Federal Reserve has said much the same thing.
Nominal bond yields were little changed in August and most key equity market indices posted respectable gains for the month. Solid earnings reports helped the local and US equity markets reach new highs, but the ASX200 closed the month below those highs. The A$/US$ slipped towards US$0.71 before recovering a few cents by the end of the month as the US$ softened on reduced expectations of US interest rate increases. Gold slipped a bit more under the impact of slightly higher US real bond yields.
Sources: Thomson Reuters, Bloomberg
Covid-19 continued to spread around the world, leading to further slowing of economic activity, disruptions to global supply chains, and pockets of inflationary pressures. At the same time, central banks continued to talk about winding back their bond-buying programs. Nevertheless, good earnings reports helped equity markets make news highs.
China was one of the countries which imposed strict lockdowns to contain the virus. While this has apparently been successful, it has also contributed to the disruption of global supply chains. For example, the closure of major port facilities and insufficient supply of container vessels has led to big increases in the cost of shipping freight around the world, as well as delays in getting that freight to its destinations. Many manufacturers have moved from relying on just-in-time delivery to stockpiling inventories of key inputs. Even so, disruptions to production have led to higher prices for many goods, of which cars have been a well-publicised example. Labour markets have also been disrupted, with difficulty in finding workers because of Covid-19 restrictions leading to higher wages in some sectors.
Given all this, it is not surprising that financial markets have been wondering about higher inflation, but in August their attention was more on the risks to economic growth. For example, latest figures illustrate the impact of the lockdowns in NSW and Victoria. Business Confidence fell again in the July data, to -7.9 from 10.6 the previous month. This was the first negative reading for Business Confidence since September 2020. Business Conditions also declined sharply in July to 11.4 after 24.9 the previous month. The Melbourne University/Westpac Consumer Sentiment index fell 4.4% in August, including higher expectations of unemployment. However, the full impact of the lockdowns on our labour market have yet to be felt. Employment rose slightly in July, and the unemployment rate fell to 4.6% from 4.9% the previous month. Even so, the underemployment rate rose in July. It is now widely expected the September quarter will see negative GDP growth.
In this environment, central banks remain focused on growth and unemployment rather than inflation. Indeed, they emphasised again that they see current inflationary pressures as transitory. For now, the markets seem inclined to give them the benefit of the doubt. However, central banks are keen to start scaling back the degree of stimulus they have been providing to markets. To be clear, this does not mean the start of monetary tightening, just a moderation in the degree of stimulus by gradually reducing the volume of bonds they have been buying from the market. This operation is colloquially known as “tapering”.
Given the weaker economic outlook for Australia in Q3, economists and investors have been expecting the RBA to delay the start of its tapering, but at its meeting in early August the Board of the RBA decided to reduce its purchases of government securities by $1 billion a week from early September to a rate of $4 billion a week until at least mid-November. The Board also said it will not increase the cash rate until inflation is sustainably within the 2 to 3 per cent target range and that it does not expect that to happen before 2024. Importantly, the Board separated tapering its bond purchases from when it would lift the cash rate.
In the US, the Federal Reserve has done much the same. There has been much speculation about what the Fed would say after its annual Jackson Hole conference. Markets are very keen to see that the Fed has learnt from its mistakes with tapering a few years ago. Fed Chair Jerome Powell also flagged a policy separating of tapering from interest rate increases. Markets expect an announcement about tapering in coming weeks. Several Fed Governors have expressed opinions about when interest rates should start to rise, but this largely focuses on late 2022 at the earliest. Both the RBA and the Fed have flagged they will watch how the economic data unfold and may adjust the pace of tapering as required.
Financial markets have taken all this in their stride and sentiment has improved as investors take heart from vaccination programs and start to look past the current Covid-19 wave. Nominal bond yields were little changed in August and most key equity market indices posted respectable gains for the month. Solid earnings reports helped the local and US equity markets reach new highs, but the ASX200 closed the month below those highs. The A$/US$ slipped towards US$0.71 before recovering a few cents by the end of the month as the US$ softened on reduced expectations of US interest rate increases. Gold slipped a bit more under the impact of higher US real bond yields.
1 Month | 3 Months | 6 Months | 12 Months | ||
Cash rates | |||||
Australia | 0.10% | 0.00% | 0.00% | 0.00% | -0.15% |
USA | 0.05% | -0.02% | 0.03% | -0.03% | -0.03% |
Japan | -0.10% | 0.00% | 0.00% | 0.00% | 0.00% |
Europe | 0.00% | 0.00% | 0.00% | 0.00% | 0.00% |
10 Government bond yields | |||||
Australia | 1.12% | -0.02% | -0.49% | -0.75% | 0.14% |
USA | 1.26% | 0.02% | -0.33% | -0.19% | 0.58% |
Japan | 0.02% | 0.02% | -0.06% | -0.14% | -0.03% |
Europe | -0.38% | 0.08% | -0.20% | -0.12% | 0.02% |
Equity markets | |||||
ASX200 | 7535 | 1.9% | 5.2% | 12.9% | 24.3% |
AREITs | 3742 | 5.3% | 9.5% | 20.5% | 24.2% |
S&P 500 | 4523 | 2.9% | 7.6% | 18.7% | 29.2% |
Topix | 1961 | 3.1% | 2.0% | 5.2% | 21.2% |
EuroStoxx | 4196 | 2.6% | 3.9% | 15.4% | 28.2% |
MSCI Emerging Markets | 1309 | 2.4% | -4.9% | -2.3% | 18.8% |
VIX volatility index | 16 | -10.3% | -2.2% | -41.0% | -37.9% |
Currency markets | |||||
AUD/USD | 0.7335 | -0.6% | -5.0% | -6.3% | -0.3% |
AUD/TWI | 61.20 | -0.6% | -3.6% | -5.1% | -2.2% |
USD/YEN | 109.86 | 0.1% | 0.4% | 3.1% | 3.6% |
EURO/USD | 1.1805 | -0.5% | -3.5% | -2.7% | -1.3% |
Commodity markets | |||||
Gold | 1806.3 | -0.9% | -5.2% | 4.6% | -8.2% |
Oil | 68.4 | -7.4% | 3.2% | 11.2% | 60.6% |
Iron Ore | 156.5 | -18.1% | -22.3% | -10.1% | 25.2% |
Coal | 145.9 | 0.0% | 45.3% | 69.5% | 189.1% |
* For cash rates and bonds the changes are % differences; for the rest of the table % changes are used
July saw markets continue to worry about the global growth profile. Some key readings of economic activity in June were lower than in previous months, leading markets to revisit the “peak growth theme”.
Potential disruption from the accelerating Covid-19 waves around the world added to these concerns. This narrative outweighed some stronger than expected inflation figures. Some key central banks started talking about reducing QE programs, given the economic data have been improving faster than they had expected. However, markets are not convinced the central banks can move as fast as they have said because of the impact of Covid-19 lockdowns on economic activity. Regulatory changes by Beijing caught markets by surprise towards the end of the month and knocked the Chinese equity markets back sharply.
Government bond yields fell further as markets priced slower growth and extended easy monetary policy. The US 10 year TIPS real yield fell to a new low of -1.16%. Equity markets performed well, with the Australia, US and MSCI World equity indices making new highs. Concerns about “peak growth” and high valuations were offset by good earnings seasons and the prospect of ongoing monetary policy support. The Emerging Markets index was dragged down by weakness in the Chinese equity market.
The price of gold rallied as the number of Covid-19 cases around the world increased and the US TIPS yield fell. A softer US$ also helped gold to rally. The A$/US$ slipped 1.8% in July to close at US$0.7381, the lowest level since early December 2020, on expectations of easier monetary policy here than in the US.
The emerging equity index and iron ore fell sharply in July in response to developments in China
Sources: Thomson Reuters, Bloomberg
The delta variant of Covid-19 has been spreading rapidly around the world. Here in Australia, the number of new cases per week has risen to nearly 1,500. While small compared with case numbers overseas, these are the largest figures we have seen since August 2020 when Australia was coming off its big second wave. Many other countries are seeing new Covid-19 waves, including the US, parts of Europe, China, Japan and South Korea. On a more positive note, countries which were earliest into the Delta wave, including the UK, Spain and Holland, are now showing falling case numbers as the number of new cases per week appears to have peaked.
Latest domestic economic news show Business Conditions in June slipping to 24.1 after 35.8 in May. Business Confidence also eased in June, however we need to remember that these figures are coming off record high levels and still represent a solid rate of growth for the economy. The labour market improved in June, with 29,100 new jobs and the unemployment rate falling to 4.9%. These figures show that conditions in the labour market continue to exceed the Reserve Bank’s expectations. The June quarter inflation figures showed headline inflation of 3.8% over the year to the end of June, but underlying inflation of only 1.6%, which is still below the Reserve Bank’s target of 2% – 3%.
Overall, these figures show our economy in a good light. Growth is respectable, unemployment is falling, and the higher headline inflation figure was due to temporary factors. The Reserve Bank flagged it is thinking about scaling back its bond-buying program in view of these developments. However, the impact of the Sydney lockdown, which has now extended to other parts of the country, has led markets to believe the Reserve Bank will have to put these plans on hold, and may even have to temporarily expand its bond buying.
A similar story applies to the US in July. Latest CPI figures were somewhat higher than expected due to temporary factors, the ISM Manufacturing PMI slipped to 59.5 from 60.8, and the unemployment rate was 5.9% in June after 5.8% the previous month. Real GDP grew 6.5% over the year to the second quarter, compared with 6.3% % over the year to the first quarter. The Federal Reserve again said it is discussing winding back its bond-buying program. Markets expect a more formal announcement in coming months.
In Europe, real GDP grew by 2% in the second quarter, well ahead of market expectations, the unemployment rate fell to 7.7%, and core inflation eased from 0.9% to 0.7% in June. The ECB announced it will continue to run an easy monetary policy for some time and will tolerate periods of inflation above 2%.
In China, GDP growth, which had been running a bit over 18% in year-on-year terms in Q1, slipped to 7.9% in Q2. However, the Q1 figure was distorted by Covid-19 induced base effects from a year earlier. The quarterly rate of growth was actually a bit higher than expected. Late in the month Beijing announced crackdowns on education providers, property developers and tech companies. These moves are motivated by concerns about national security and social inequality. Markets were blind-sided by these developments and the share prices of effected companies fell sharply. Markets were already assessing prospects for slower growth in China and the impact of the new Covid-19 wave appearing in parts of the country. In response to these concerns, Beijing announced more fiscal stimulus will be used to support the economy.
In this environment, government bond yields fell further as markets priced slower growth and extended easy monetary policy. The Australian 10 year government yield fell 0.37% in July to end at 1.12%, the lowest level since January 2020. In the US, the equivalent bond yield fell 0.21% to 1.24%. Similar declines in yields were seen in European markets. The US 10 year TIPS real yield fell to a new historic low of -1.16%.
Equity markets performed well, with the Australian, US and MSCI World equity indices making new highs. Concerns about “peak growth” and high valuations were offset by good earnings seasons and the prospect of ongoing monetary policy support. The Emerging Markets index was dragged down by weakness in the Chinese equity market.
The price of gold rallied as the number of Covid-19 cases around the world increased and the US TIPS yield fell. A softer US$ also helped gold to rally.
The A$/US$ slipped 1.8% in July to close at US$0.7381, the lowest level since early December 2020. The currency slipped as the Australia-US bond differential narrowed on expectations of easier monetary policy here than in the US.
31-Jul-21 | Changes over periods shown:* | ||||
1 Month | 3 Months | 6 Months | 12 Months | ||
Cash rates | |||||
Australia | 0.10% | 0.00% | 0.00% | 0.00% | -0.15% |
USA | 0.07% | 0.02% | 0.04% | -0.01% | -0.01% |
Japan | -0.10% | 0.00% | 0.00% | 0.00% | 0.00% |
Europe | 0.00% | 0.00% | 0.00% | 0.00% | 0.00% |
10 Government bond yields | |||||
Australia | 1.12% | -0.37% | -0.53% | 0.03% | 0.30% |
USA | 1.24% | -0.21% | -0.39% | 0.14% | 0.70% |
Japan | 0.01% | -0.05% | -0.08% | -0.03% | -0.01% |
Europe | -0.46% | -0.26% | -0.26% | 0.06% | 0.08% |
Equity markets | |||||
ASX200 | 7393 | 1.1% | 5.2% | 11.9% | 24.7% |
AREITs | 3554 | 0.6% | 5.4% | 11.9% | 26.5% |
S&P 500 | 4395 | 2.3% | 5.1% | 18.3% | 34.4% |
Topix | 1901 | -2.2% | 0.1% | 5.1% | 27.1% |
EuroStoxx | 4089 | 0.6% | 2.9% | 17.5% | 28.8% |
MSCI Emerging Markets | 1278 | -7.0% | -5.2% | -3.9% | 18.4% |
VIX volatility index | 18 | 15.6% | -2.0% | -44.6% | -25.4% |
Currency markets | |||||
AUD/USD | 0.7381 | -1.8% | -5.1% | -3.5% | 2.3% |
AUD/TWI | 61.60 | -1.8% | -4.3% | -2.2% | -0.5% |
USD/YEN | 109.75 | -1.1% | 0.4% | 4.8% | 3.8% |
EURO/USD | 1.1858 | 0.0% | -1.5% | -2.4% | 0.3% |
Commodity markets | |||||
Gold | 1823.2 | 3.3% | 3.0% | -1.9% | -7.7% |
Oil | 73.6 | 0.1% | 15.9% | 41.1% | 83.6% |
Iron Ore | 191.0 | -11.4% | 2.1% | 20.9% | 74.4% |
Coal | 125.3 | 0.0% | 33.5% | 47.6% | 139.9% |
* For cash rates and bonds the changes are % differences; for the rest of the table % changes are used.