Summary
Market performance was mixed in November, with heightened volatility creating a clear divide between defensive and growth assets. After a sharp mid-month pullback, most major equity indices ended close to flat as sentiment oscillated between strong earnings results and growing caution around artificial intelligence (AI) driven optimism.
Infrastructure was the standout performer, supported by resilient income streams and sustained demand for utilities. Global equities finished broadly flat, while bond yields diverged as differences in rate cycles became more pronounced, with the US outperforming peers. Gold also recovered, edging back toward recent highs around US$4,220.
Selected market returns (%)
NOVEMBER 2025
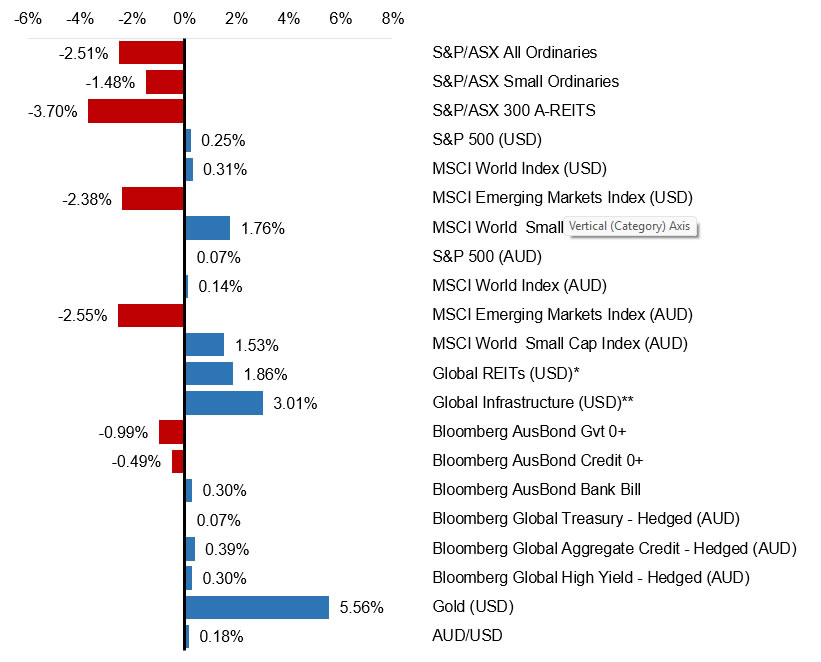
Sources: *FTSE EPRA/NAREIT DEVELOPED, **FTSE Global Core Infrastructure 50/50 Index
Financial markets
Global equity markets ended flat in November, with the MSCI World Index (USD) up 0.31%, as investors grew more cautious on the AI thematic and questioned the sustainability of recent earnings strength and elevated capital expenditure. US bond yields continued to trend lower, driven by expectations of rate cuts over the next 12 months.
Australian equities
The S&P/ASX All Ordinaries Index fell -2.51% in November, bringing the calendar year-to-date (YTD) return to 5.36%.
The ASX underperformed global peers over the month, driven by a mix of stock-specific pressures and a more challenging
domestic inflation and interest rate backdrop. Commonwealth Bank, which had been trading at stretched valuation levels, retraced sharply and weighed on the broader financials sector. Investor appetite also shifted away from high-valuation growth names, reflecting a more cautious global tone as optimism around the AI cycle moderated.
Despite the weakness in financials and growth sectors, the materials sector provided support, with lithium companies rebounding after a difficult year and gold miners benefiting from higher prices.
The S&P/ASX Small Ordinaries Index fell -1.48%, reflecting the broader market trend as diminishing expectations of rate cuts weighed on sentiment across the small-cap sector.
Global equities
In the US, performance was mixed with the S&P 500 Index edging up 0.25% (USD), the Nasdaq Composite fell -1.51% (USD), while the Russell 2000 Index gained 0.85% (USD).
Global equity markets experienced a volatile month as investors reassessed the durability of the AI-driven rally. Despite record earnings from Nvidia, investors are increasingly demanding clearer evidence that the unprecedented AI capex cycle, spanning data centres, chips, robotics, and cloud infrastructure, can deliver sustainable returns on the significant capital invested.
Emerging markets declined -2.38% (USD) as a stronger US dollar, and the AI-related sell-off weighed on sentiment, with MSCI Korea down -8.00% (USD) and MSCI Taiwan falling -5.01% (USD).
Commodities
Gold rebounded from its fall in October, ending the month up 5.56% (USD). West Texas Intermediate (WTI) crude oil fell -5.10% as markets grappled with a combination of softer demand indicators and rising supply.
Bond markets
Fixed income markets experienced notable swings over the month as investors reassessed the global monetary policy path. In the US, the 10-year Treasury yield drifted 8bps lower to 4.02%, reflecting growing expectations for 3–4 rate cuts by the end of next year. In contrast, Australia’s 10-year bond yield rose 30bps to 4.53%, driven by stubborn domestic inflation and a more hawkish Reserve Bank of Australia (RBA), relative to global peers.
Credit markets held up well, supported by healthy corporate balance sheets and solid corporate earnings trends. However, there is limited room for further spread tightening unless global growth meaningfully re-accelerates.
Economic developments
The economic data blip
The recent 43-day US federal government shutdown resulted in a significant disruption to US data visibility.
The Bureau of Labour Statistics (BLS) confirmed that October’s Employment Report, including the unemployment rate, would be cancelled after the shutdown halted essential data collection. October nonfarm payrolls will be merged into November’s release, while the October CPI report was also cancelled, with figures only to be published where data can be reliably reconstructed alongside November 2025 CPI. The shutdown is expected to weigh on fourth-quarter GDP before contributing to a mechanical rebound in Q1 2026.
The absence of timely information has increased uncertainty around the near-term path of US monetary policy, especially amid concerns about sticky inflation and weakening labour market conditions heading into year-end.
Despite this, markets are currently pricing in an ~ 88% probability of a rate cut at the Federal Reserve’s (Fed) meeting in December.
The new datapoint everyone will be watching
Australia has shifted to a monthly Consumer Price Index (CPI) framework, moving away from the quarterly series to improve the timeliness of inflation monitoring.
The latest figures showed inflation picking up again, with annual headline CPI rising to 3.8% in October, up from 3.6% in September. Underlying inflation also firmed, with the monthly trimmed mean, which removes volatile items, rising 0.3% month-on-month and 3.3% year-on-year. Housing was the largest contributor to the CPI rise, driven by sharp increases in electricity costs, rents, and new dwelling prices, while food and recreation also added upward pressure. The strength in rents and construction costs will make it difficult for overall inflation to return to 2.5% in the near term, particularly with many service categories still rising above 3%.
With inflation still sitting well above the RBA’s 2–3% target range, the data reinforces expectations that the interest-rate cutting cycle has ended unless the labour market deteriorates significantly.
As a result, the RBA held rates steady at its November meeting, with the decision unanimous and no consideration given to a rate cut. The Board highlighted that inflation has picked up, noting that the broader economy is showing signs of improving momentum. Domestic activity is lifting, consumption has firmed, the housing market continues to strengthen, and credit conditions have eased.
Outlook
Ultimately, earnings growth is the primary driver of equity returns.
With most major markets entering 2026 with solid earnings momentum, particularly in the US and parts of Asia, the backdrop for equities remains broadly constructive.
The accelerating AI thematic adds another layer of support, provided that productivity gains, data-centre investment and automation continue to deliver multi-year earnings tailwinds across sectors. While the path is unlikely to be linear, and questions remain around whether the scale of capital expenditure will ultimately generate sufficient returns, the potential for AI to be genuinely transformative offers a supportive narrative for long-term equity growth.
Volatility will remain a feature of markets as investors react to key macro factors, including inflation trends, labour-market data, and the evolving monetary and fiscal policy landscape. In this environment, remaining flexible and maintaining diversification remains essential.
Major market indicators
| 30-Nov-25 | 31-Oct-25 | 30-Sep-25 | Qtr change | 1 year change | |
| Interest Rates (at close of period) | |||||
| Aus 90-day Bank Bills | 3.65% | 3.56% | 3.58% | +4.0 | -77.0 |
| Aus 10yr Bond | 4.53% | 4.23% | 4.30% | +25.8 | -1.1 |
| US 90-day T-Bill | 3.73% | 3.73% | 3.86% | -32.0 | -66.0 |
| US 10 yr Bond | 4.02% | 4.10% | 4.15% | -20.4 | -17.5 |
| Currency (against the AUD) | |||||
| US Dollar | 0.656 | 0.655 | 0.663 | 0.20% | 0.67% |
| British Pound | 0.494 | 0.498 | 0.492 | 1.90% | -3.74% |
| Euro | 0.564 | 0.566 | 0.563 | 0.64% | -8.56% |
| Japanese Yen | 102.29 | 100.83 | 97.81 | 6.33% | 4.76% |
| Trade-Weighted Index | 61.20 | 61.20 | 61.30 | 1.16% | -0.49% |
| Equity Markets | |||||
| Australian All Ordinaries | -2.5% | 0.5% | -0.5% | -2.6% | 5.8% |
| MSCI Australia Value (AUD) | -3.0% | 2.0% | -1.6% | -2.7% | 7.0% |
| MSCI Australia Growth (AUD) | -3.8% | -1.9% | -2.0% | -7.5% | -6.0% |
| S&P 500 (USD) | 0.2% | 2.3% | 3.6% | 6.3% | 15.0% |
| MSCI US Value (USD) | 1.8% | -0.9% | 1.8% | 2.6% | 5.0% |
| MSCI US Growth (USD) | -1.4% | 5.1% | 5.3% | 9.2% | 24.0% |
| MSCI World (USD) | 0.3% | 2.0% | 3.3% | 5.7% | 17.5% |
| Nikkei (YEN) | -4.1% | 16.7% | 5.9% | 18.4% | 34.1% |
| CSI 300 (CNY) | -2.4% | 0.2% | 3.3% | 1.1% | 18.8% |
| FTSE 100 (GBP) | 0.4% | 4.1% | 1.8% | 6.4% | 21.5% |
| DAX (EUR) | -0.5% | 0.3% | -0.1% | -0.3% | 21.5% |
| Euro 100 (EUR) | 0.1% | 3.1% | 4.4% | 7.8% | 22.5% |
| MSCI Emerging Markets (USD) | -2.4% | 4.2% | 7.2% | 9.0% | 30.3% |
| Commodities | |||||
| Iron Ore (USD) | -0.8% | 3.7% | -0.7% | 2.2% | 1.2% |
| Crude Oil WTI U$/BBL | -5.1% | -2.2% | -1.8% | -9.0% | -14.2% |
| Gold Bullion $/t oz | 5.6% | 3.8% | 11.4% | 22.0% | 57.9% |
Sources: Quilla, Refinitiv Datastream