
Economic Snapshot
July 2026
In summary
Volatility returned to Global markets in July, with renewed tensions in the Middle East causing a whipsawing in the price of crude oil, which rose by 37% intra-month before closing July at $85.
The Australian equity market outperformed global equities in July. The weakness in global equities was driven by a sharp reversal in semiconductor stocks, which pushed the Nasdaq 100 into a technical correction, with the index falling 11% from its June highs. Leveraged ETFs and hedge fund trading activity amplified this decline. The ASX, however proved resilient, supported by strength in the energy and banking sectors.
Persistently high and above-target inflation has continued to be a concern in many major economies, including the US, Eurozone and Australia. The market continues to expect at least one more rate hike in Australia, the US, Europe, the UK and Japan by the end of 2026, with these expectations weighing on government bond yields.
Australian benchmark 10-year bond yields remained rangebound between 4.75% and 5.10% through July. The Australian dollar similarly traded sideways between $0.691 and $0.702.
Selected market returns (%)
JULY 2026
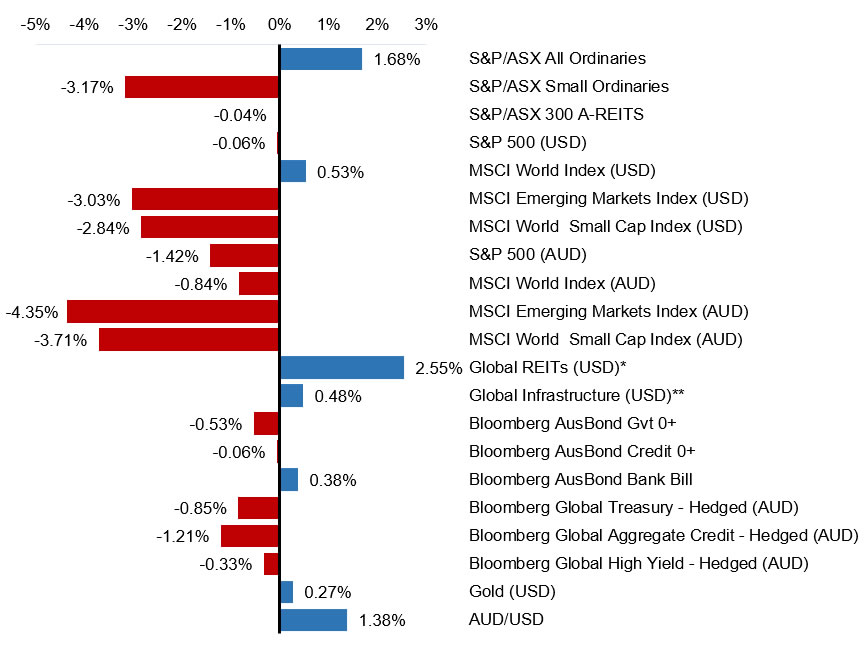
Sources: *FTSE EPRA/NAREIT DEVELOPED, **FTSE Global Core Infrastructure 50/50 Index
Key Market and Economic Developments in July 2026
Financial markets
Financial markets experienced mixed results in July, with the US technology sector and emerging markets weighed down by a selloff in semiconductors and artificial intelligence (AI) related companies. Mega-cap technology earnings results were mixed, with Microsoft and Amazon reporting strong earnings results while Meta and Alphabet sold off despite strong earnings growth due to concerns around AI monetisation.
Australian equities
The S&P/ASX All Ordinaries Index rose by 1.7% in July, supported by energy stocks which rose by 12.2% and financials which rallied 5.8%. Despite a softening housing market, the share prices of Australian banks rose strongly, following a rotation back to quality defensive names, a dynamic that also supported the Healthcare sector.
The materials sector lagged during the month due to softer base metal prices. The local information technology sector also struggled, falling 2.8% in line with weakness in the global sector. Small caps materially underperformed large caps in July, with the S&P/ASX Small Ordinaries Index falling 3.2%.
Global equities
Global equity markets made moderate gains in July. The MSCI World Index rose 0.5% (USD), led by the UK and Europe, supported by better-than-expected earnings results. In the US, the S&P500
closed the month flat, with technology stocks weighing on performance amid concerns about the future profitability of AI companies. The energy, financials and consumer staples sectors saw strong gains.
Japanese equities retreated -8.1% (JPY) over the month, led by the technology sector. Emerging market equities also experienced significant falls, dropping 4.4% in July. Large semiconductor companies (TSMC, Samsung and SK Hynix), which account for 24% of the Emerging Market Index, drove the majority of the falls.
Commodities
Crude oil prices rose sharply by 22.1% in July, driven by the resumption of military activity between the US and Iran.
Gold prices were largely range-bound during July. The precious metal continued to benefit from geopolitical uncertainty, although gains were tempered by elevated US Treasury yields and expectations that the Federal Reserve (Fed) may maintain a restrictive interest rate policy stance.
Bond markets
Bond markets continued to face headwinds in July due to sticky inflation fears placing upward pressure on government bond yields. Persistently above-target inflation has markets expecting rate hikes in both the US and Europe. The US 10-year Treasury yield peaked at 4.71% during the month, its highest level in over a year, while the US 30-year also traded up to 5.24%, the highest level since late 2023.
The Australian 10-year government bond yield fluctuated between 4.75% to 5.10% before ending the month at 4.75%, as market fears of persistent inflation increased due to the re-escalation between the US and Iran.
Economic developments
Domestic economic data remains soft
Australian inflation surprised to the downside. The Headline Consumer Price Index (CPI) rose 3.8% over the year to June, down from 4.0% in May and below expectations, while consumer prices fell 0.1% in the month for a second month running. The Reserve Bank of Australia’s (RBA) preferred trimmed mean CPI measure held at 3.6%, also undershooting forecasts.
Consumer and business confidence data remained subdued, reinforcing a soft domestic economic outlook. Labour market data showed the unemployment rate remained steady at 4.4%, but with signs of loosening conditions.
The housing market has continued to weaken, with banks reporting a sharp fall in loan applications, particularly from the investor market. House price falls have accelerated in Sydney and Melbourne, with Brisbane and Adelaide markets also now falling.
A reescalation in the Middle East conflict
During July a US–Iran memorandum of understanding collapsed, and the US resumed military strikes, reigniting the conflict and threatening shipping through the Strait of Hormuz and the Red Sea. Oil climbed as supply-disruption fears mounted. Late in July, the picture shifted once again with the US pausing its strike campaign and signalling fresh talks. Separately, OPEC+ approved another modest oil production increase.
The US Fed left its target rate unchanged at 3.50–3.75% on 29 July. This was not a unanimous decision, with three dissenting members within the board favouring hiking rates. Chair Kevin Warsh described the jobs market as “steady” while stressing the need to target inflation as a priority.
The US Consumer Price Index (CPI) fell a seasonally adjusted 0.4% for the month of June, its largest monthly drop since April 2020. However, concerns remain that this easing of inflation will be only temporary as uncertainty in the Middle East persists. With the annual inflation rate of 3.5% still materially higher than the central bank’s 2% target, it is expected that the Fed, under the new Chair,
will be forced to adjust monetary policy settings when it next meets in September in order to deliver on price stability.
Outlook
The near-term picture hinges on two forces pulling in opposite directions. A durable de-escalation between the US and Iran would relieve energy prices and imported inflation, giving central banks room to pause. A relapse would do the reverse, keeping oil elevated and bond yields under upward pressure.
In equities, the July sell-off was concentrated with AI and semiconductor names rather than broad-based. Strong results from the largest US cloud providers suggest the AI investment cycle still has support, but investors will keep testing whether that infrastructure spending earns an adequate return. Improving market breadth across sectors and regions beyond mega-cap technology is a healthy signal for the market’s foundations.
In Australia, the economic outlook is more balanced. The current weakness in domestic conditions is expected to persist as cost-of-living pressures, a weak housing market, and low confidence weigh on growth. Meanwhile, softer inflation and a steady labour market have reduced, but not eliminated, the pressure for further interest rate rises.
Against this backdrop, we continue to have a constructive outlook for global equity markets while we remain cautious on bond markets and interest rate sensitive sectors under a
higher-for-longer interest rate environment.
Major market indicators
| 31-Jul-26 | 30-Jun-26 | 31-May-26 | Qtr change | 1 year change | |
| Interest Rates (at close of period) | |||||
| Aus 90-day Bank Bills | 4.50% | 4.46% | 4.43% | +16.0 | +82.0 |
| Aus 10yr Bond | 4.75% | 4.83% | 4.98% | -21.5 | +46.3 |
| US 90-day T-Bill | 3.69% | 3.74% | 3.60% | +10.0 | -55.0 |
| US 10 yr Bond | 4.71% | 4.44% | 4.44% | +31.6 | +35.0 |
| Currency (against the AUD) | |||||
| US Dollar | 0.702 | 0.693 | 0.720 | -2.31% | 9.09% |
| British Pound | 0.523 | 0.519 | 0.533 | -1.06% | 7.22% |
| Euro | 0.611 | 0.603 | 0.615 | 0.16% | 8.03% |
| Japanese Yen | 111.98 | 112.48 | 114.47 | -0.74% | 15.62% |
| Trade-Weighted Index | 65.50 | 64.60 | 66.60 | -1.21% | 8.62% |
| Equity Markets | |||||
| Australian All Ordinaries | 1.7% | 0.4% | 1.2% | 3.3% | 4.8% |
| MSCI Australia Value (AUD) | 4.1% | 0.8% | 1.4% | 6.3% | 18.2% |
| MSCI Australia Growth (AUD) | 1.6% | 2.9% | -1.7% | 2.9% | -12.0% |
| S&P 500 (USD) | -0.1% | -1.0% | 5.3% | 4.2% | 19.6% |
| MSCI US Value (USD) | 2.9% | -0.2% | 2.4% | 5.1% | 21.0% |
| MSCI US Growth (USD) | -2.9% | -1.5% | 8.2% | 3.6% | 16.6% |
| MSCI World (USD) | 0.5% | -0.7% | 4.6% | 4.4% | 20.9% |
| Nikkei (YEN) | -8.1% | 5.7% | 11.9% | 8.7% | 59.4% |
| CSI 300 (CNY) | -7.4% | 2.3% | 1.9% | -3.4% | 15.1% |
| FTSE 100 (GBP) | 3.6% | 1.0% | 0.7% | 5.4% | 22.8% |
| DAX (EUR) | 2.5% | -0.4% | 3.3% | 5.5% | 6.5% |
| Euro 100 (EUR) | 0.1% | 4.7% | 3.7% | 8.6% | 25.6% |
| MSCI Emerging Markets (USD) | -3.0% | -1.4% | 9.7% | 4.9% | 37.1% |
| Commodities | |||||
| Iron Ore (USD) | -3.6% | -6.3% | -1.7% | -9.7% | -2.7% |
| Crude Oil WTI U$/BBL | 22.1% | -22.6% | -16.1% | -5.5% | 22.5% |
| Gold Bullion $/t oz | 0.3% | -12.1% | -0.6% | -11.9% | 22.8% |
Sources: Quilla, Refinitiv Datastream