2026 Financial Year in review
The Financial Year 2026 was a strong year for global equities, driven by beneficiaries of the artificial intelligence (AI) infrastructure build-out that favoured US technology companies and select emerging markets. Australian equities lagged, held back by a scarcity of listed AI beneficiaries.
The US Federal Reserve (Fed) cut interest rates through late 2025 and has held since. The Reserve Bank of Australia (RBA) shifted swiftly from a cut to the cash rate in the second half of 2025 to three 25 basis point hikes in the first half of 2026 as inflation remained persistent.
The sharpest market moves came in March 2026, when the US-Israeli conflict with Iran and a closure of the Strait of Hormuz drove oil above US$100. This triggered a broad global equity market selloff, before a ceasefire sparked a sharp recovery in April, solidified by the signing of a memorandum of understanding in June.
Key Market and Macroeconomic Developments over the Year
| July 2025 | Equity markets continued to push higher sharply, with several markets making new all-time highs. The MSCI World advanced a substantial +3.1%, largely driven by the US, while the MSCI Emerging Markets Index was up +3.8% with continued strength from East Asia. Fiscal stimulus was provided by President Trump’s budget, the ‘One Big Beautiful Bill’ (‘OBBB’), which passed both houses of Congress. The OBBB extended and increased tax cuts to US households, giving an expected boost to the economy starting in 2026. However, bond investors noted that this came at the cost of increasing expected budget deficits by $3.3T over the decade, elevating risks around the increasing national debt and fiscal sustainability. |
| August 2025 | The ASX reporting season in August led to a positive but volatile month, with companies again exhibiting large single-day moves when reporting their annual results. Value-style stocks (+7.1%) performed strongly, well in advance of Growth (-2.9%), while the Small Ordinaries index (+8.4%) considerably outperformed the broader ASX 200 Index (+3.1%). Resources were the best performing sector, with the largest contributors being gold miners, while Healthcare stocks (-16%) continued their weak run of performance. ASX heavyweight CSL had its worst day on record, falling -15% and finishing the month down -21.7%, while other healthcare companies also fell substantially. |
| September 2025 | Global equity markets surged in September with strong advances across technology sectors as part of the ongoing AI boom. Major players in the sector announced deals, including a $100b partnership between OpenAI and Nvidia, and the $500b ‘Stargate’ data centre complex in Texas by Oracle. The impact rippled across the technology supply chain, with producers of technology equipment, semiconductor chips and energy infrastructure all seeing record demand. Asian markets and US technology firms remained the primary beneficiaries, with the Nasdaq 100 Index up another +4.2% while the MSCI Emerging Markets Index was up a hefty +5.8% during the month. Markets with less exposure to technology themes, such as Australia or Europe, were notably weaker. In the US, the Federal Reserve cut rates for the first time in 2025, citing a slowing labour market and improving inflation. This change came after pressure from President Trump, leading to some speculation about the Fed’s independence from the White House. |
| October 2025 | October was another very strong month for global equities, with developed and emerging market companies continuing to push higher. However, the month was not without challenges, with a US Government shutdown that began on October 1, instigated by the Democratic Senate caucus, protesting cuts to Federal healthcare and social benefits. The shutdown led to interruptions in the collection of economic data. Despite the interruption of official inflation and labour market data, the US Fed cut rates again in late October, taking the new policy rate to 3.75% – 4.0%. Along with the advancing equity markets, gold broke through $4,000 for the first time, making new all-time highs, highlighting strong demand from investors seeking returns and diversification. |
| November 2025 | Markets finally cooled in November, after consecutive months of strong growth across global equity markets. The ASX 200 fell by -2.7%, led lower by weaker technology companies and the healthcare sector. The developed MSCI World index was flat while emerging markets fell -2.5%. Speculative assets were hit hardest, such as Bitcoin which fell -16.5%. The US Q3 reporting season wrapped up in November, with companies reporting very strong annual earnings growth of 14%, well ahead of analyst expectations. The ‘Magnificent 7’ mega-cap technology companies continued to deliver strong results, growing faster than the rest of the market, with annual earnings growth of 21%, showing a level of market dominance. |
| December 2025 | Markets finished 2025 with another muted month, with markets mostly flat for the month. East Asian markets were again the best performers, after a historic year for both Korea and Taiwan, especially, driven by booming AI demand for semiconductor chips. The US S&P 500 ended the calendar year with a USD return of +16.4%. The US Fed again cut rates, as did the Bank of England, as central bankers continue to be confident that inflation is coming under control. The RBA held rates steady in its December meeting but noted that higher inflation in recent months was concerning. This led to speculation about possible Australian rate hikes in 2026, posing a risk to the established domestic economic outlook. The prospect of higher rates led to a rally in the Australian dollar to $0.67, its highest level since 2024. |
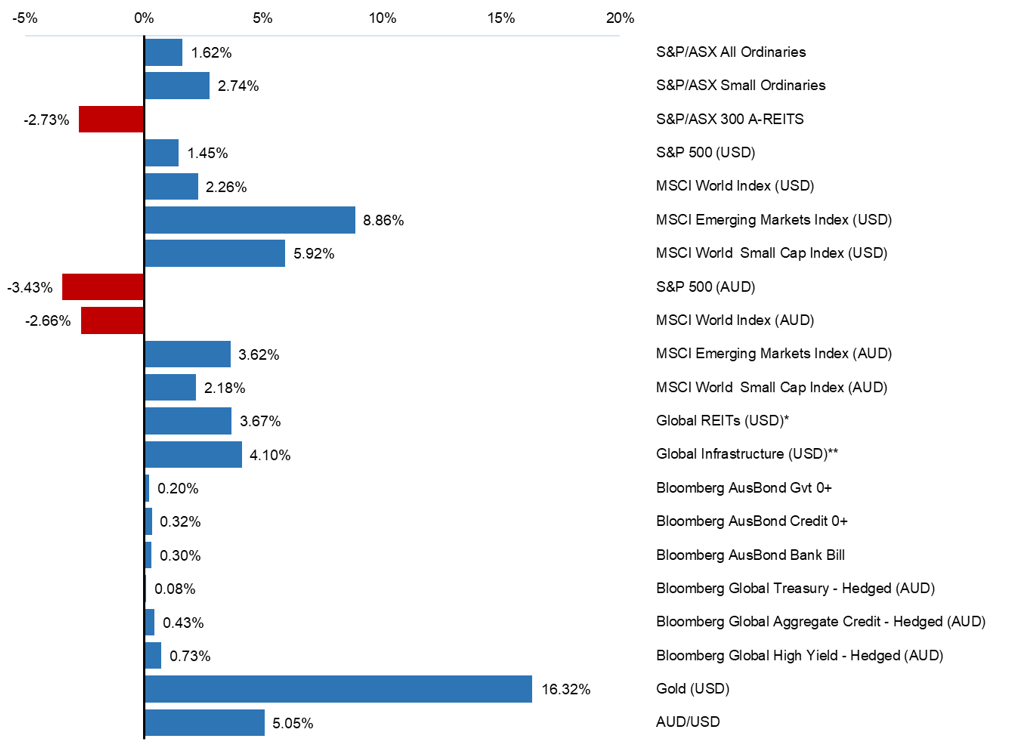
| January 2026 | The MSCI World Index rose +2.26% (USD), with the AI theme favouring hardware over software and emerging markets surging 8.9% on a weaker US dollar and AI supply-chain leadership. The ASX All Ordinaries gained 1.62%, driven by resources (gold and copper), while higher yields pressured technology and REITs. Gold soared 16.3% before a late-month pullback, and WTI rose 12.6% on building geopolitical risk. Firmer-than-expected US and Australian inflation pushed bond yields higher, with markets beginning to expect the RBA to start a hiking cycle. |
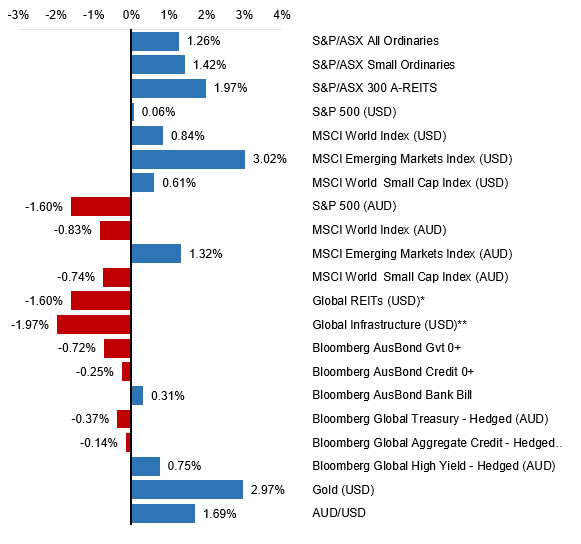
| February 2026 | Global equities were mixed with the MSCI World Index gaining +0.76% (USD) as the rotation out of US mega-cap technology continued. The S&P 500 slipped on software weakness while Japan and emerging markets outperformed. The ASX All Ordinaries rose 3.34% on a strong reporting season led by the major banks and materials, with BHP reaching record highs. The RBA delivered its first hike in over two years, lifting the cash rate 25bps to 3.85% on persistent inflation. A US Supreme Court ruling struck down emergency tariff powers, but the administration quickly reimposed levies by other means. Silver jumped 25.9%. |
| March 2026 | Markets sold off sharply as the US-Israeli conflict with Iran and a closure of the Strait of Hormuz triggered an oil supply shock, pushing crude above US$100 (+53.6%) and raising stagflation fears. Equities fell broadly and especially in economies that are net oil importers. The ASX All Ordinaries dropped 7.3% and Japan’s Nikkei fell 13.2%, its worst month since the Global Financial Crisis, while the US, a net energy exporter, was relatively insulated with the S&P 500 down 5%. The RBA hiked for a second consecutive meeting, to 4.10%, while the Fed held. Australian 10-year yields rose above 5%, their highest since 2011, and gold fell 12% on forced liquidations from traders and emerging market central banks. |
| April 2026 | Markets staged a sharp recovery with the MSCI World Index rallying +9.6% (USD) after March’s selloff, led by US technology companies and emerging markets. A fragile US-Iran ceasefire took hold, helping lift the S&P 500 +10.5% and Japan’s Nikkei +16.1%. The ASX All Ordinaries lagged at +2.36%, weighed by fuel-security concerns, a stronger Australian dollar and a hawkish RBA. AI dispersion widened as investors rewarded companies showing signs of AI monetisation (Alphabet, Amazon). Oil remained volatile (Brent +12.63%), and the UAE announced its exit from OPEC+. US CPI rose at its fastest pace since 2022. The Fed, ECB and BoE all held interest rates, with the Fed’s 8-4 vote its most divided since 1992. |
| May 2026 | The equity market rally continued strong US earnings, with the Magnificent 7 lifting AI capex guidance, supporting semiconductor share prices. Japan rose +11.9% and emerging markets +9.7%. The ASX All Ordinaries underperformed at +1.22%, held back by a scarcity of listed AI beneficiaries and an Australian Federal Budget that proposed curbs to the CGT discount and negative gearing, which triggered a sell-off in the major banks. The RBA raised the cash rate to 4.35%, and Kevin Warsh was sworn in as the new US Fed Chair. US 10-year yields peaked at 4.66%, the highest in over a year, while crude eased to US$88 (-16.1%). |
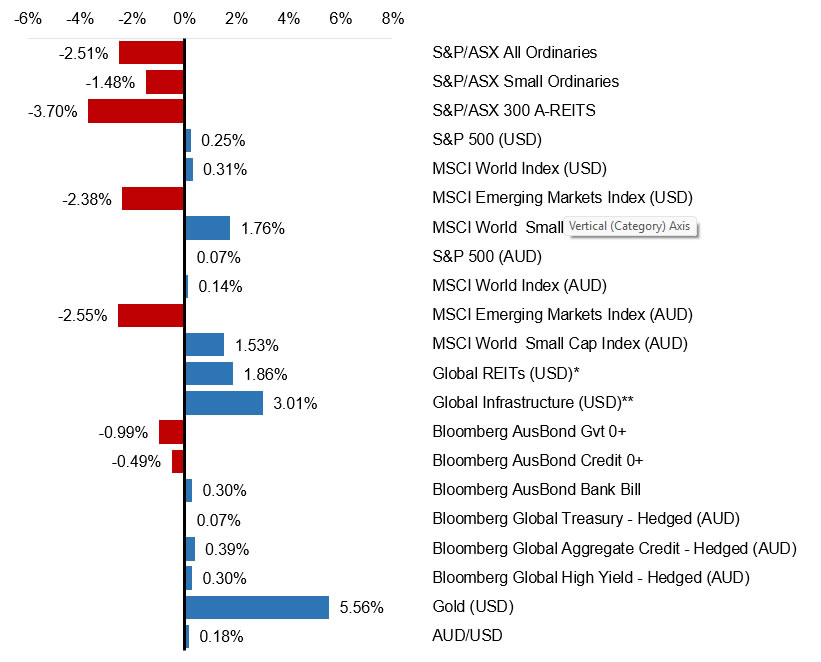
| June 2026 | De-escalation in the Middle East defined the month. On 17 June, the US and Iran signed a 60-day memorandum of understanding that began reopening the Strait of Hormuz, unwinding the war premium and pulling oil sharply lower. Risk assets rallied, again led by US technology and AI beneficiaries. The S&P 500 fell -0.95% in USD but rose 2.57% in AUD terms as the Australian dollar weakened against a firmer US dollar. Most developed markets gained in both local and AUD terms. The ASX All Ordinaries rose +0.37%, with a strong healthcare sector recovery offsetting falls in energy and materials. The Small Ordinaries Index fell -2.00%, weighed by materials exposure. The RBA held the cash rate at 4.35% on 16 June after three hikes earlier in the year, keeping a hawkish tone, while Kevin Warsh chaired his first and notably hawkish FOMC. Gold retraced as geopolitical risk faded. |
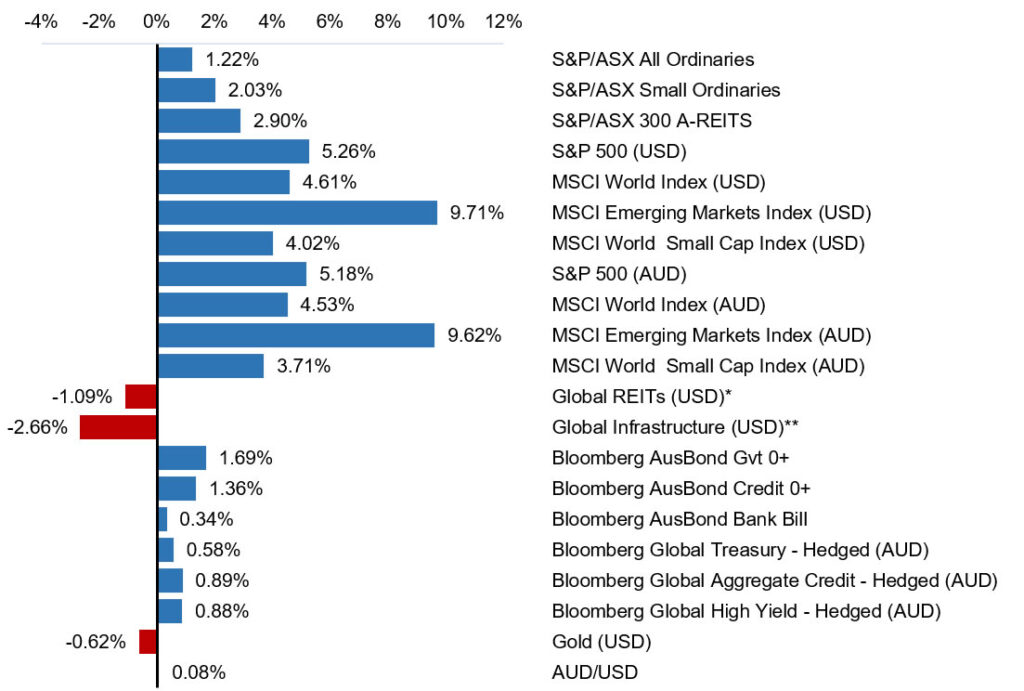
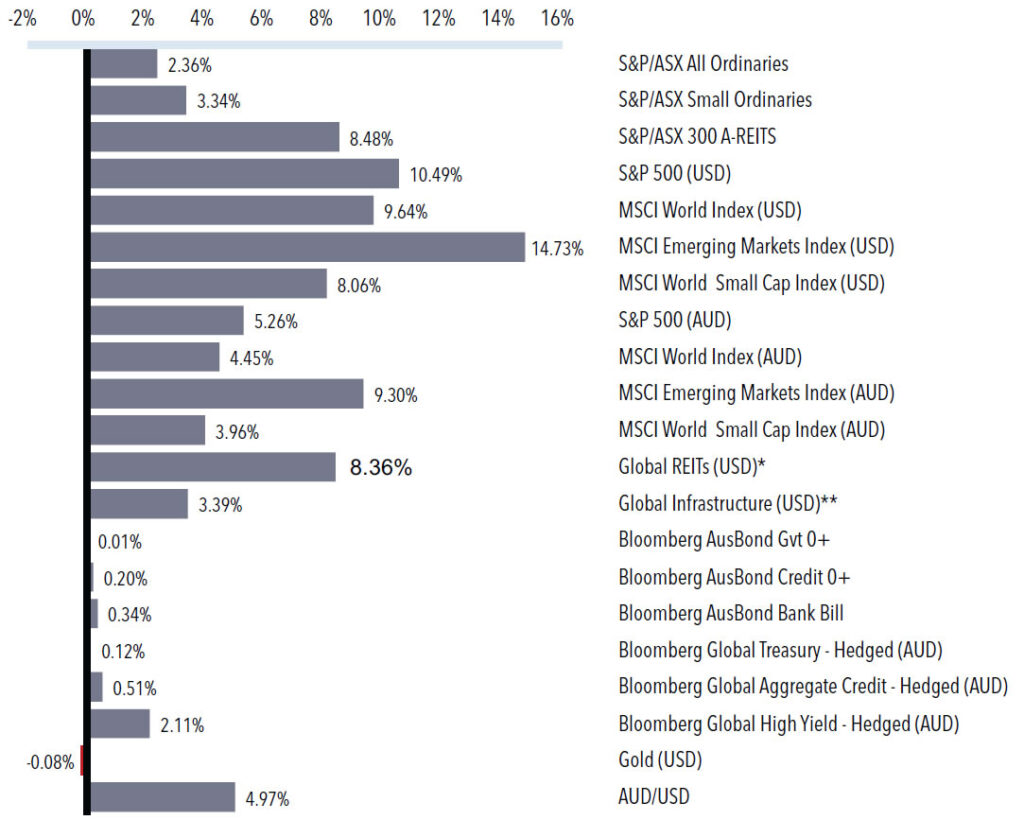
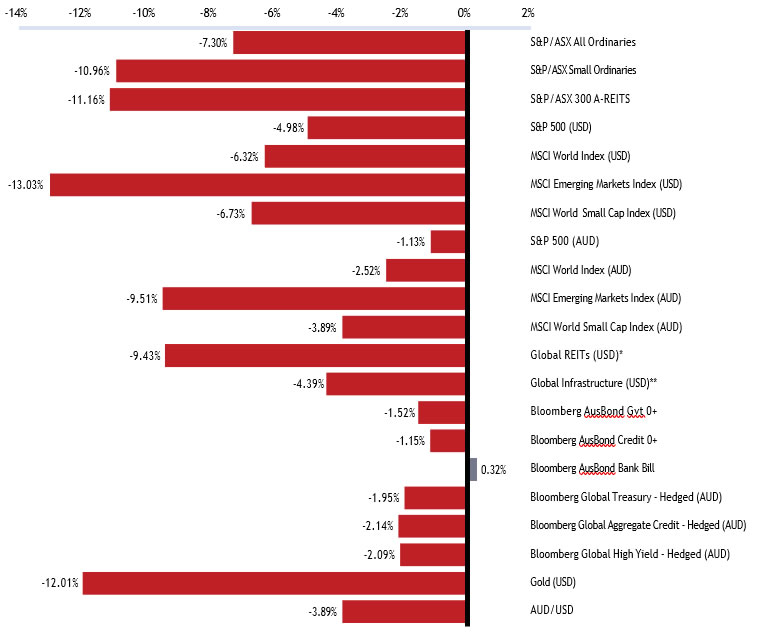
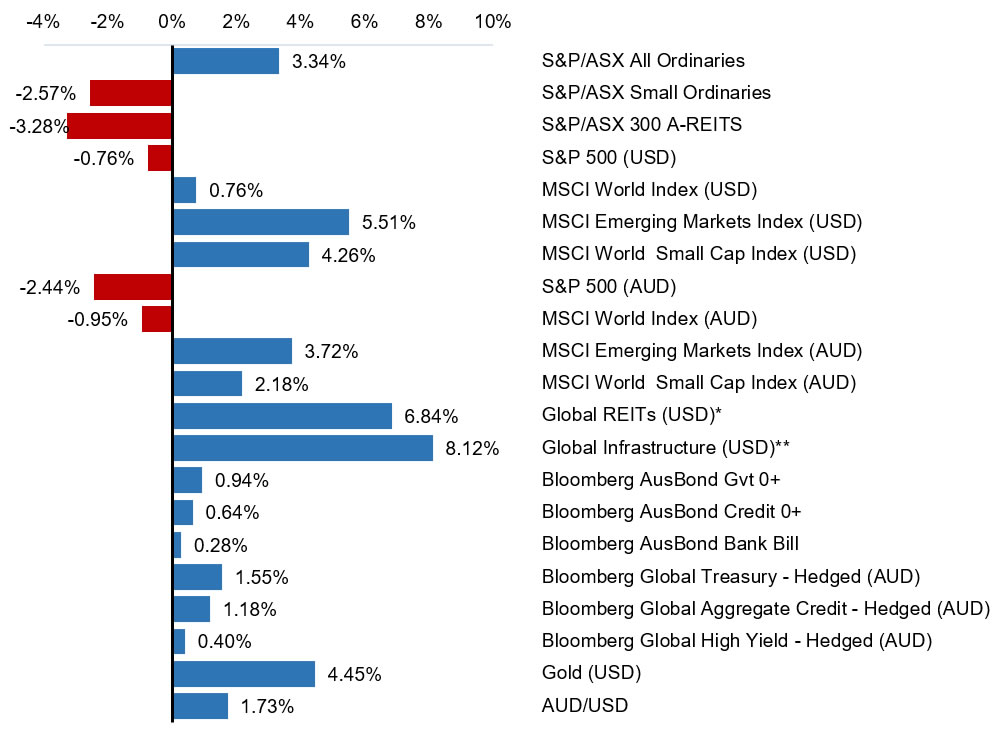
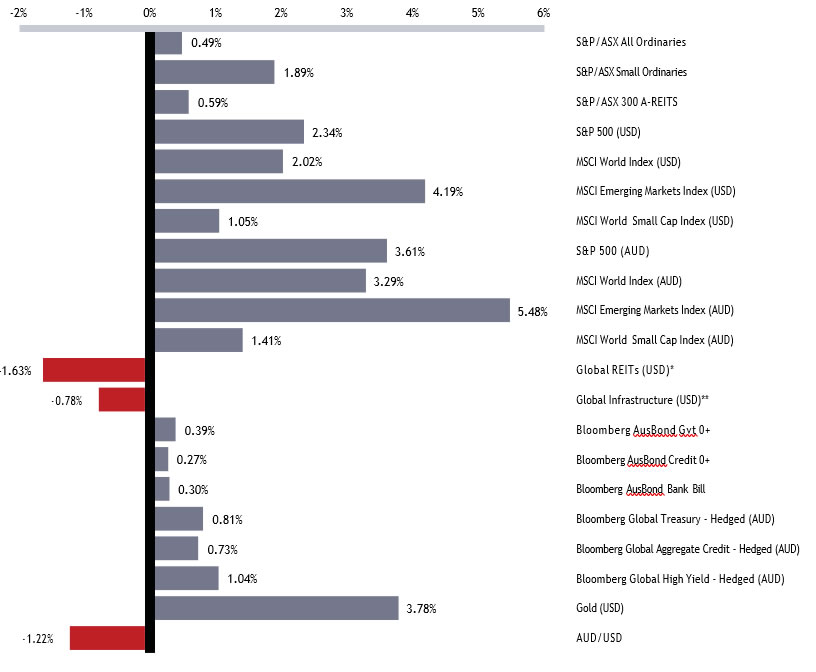
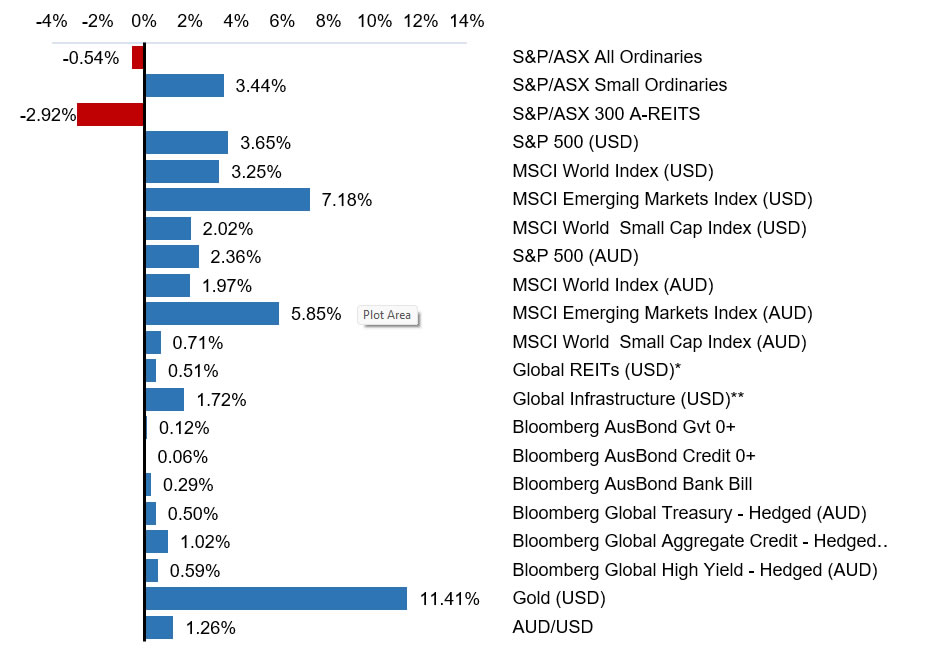
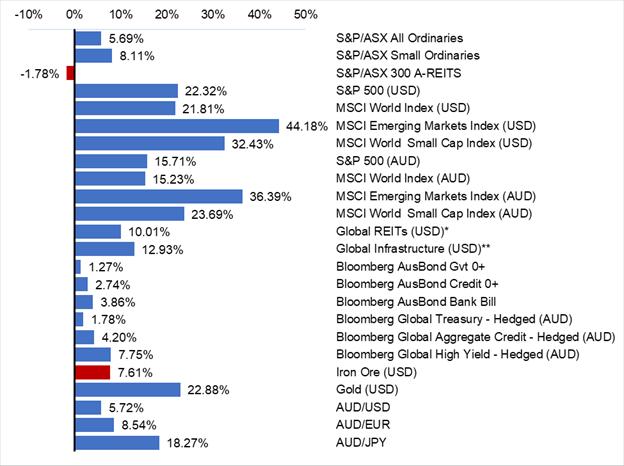
Selected market returns (%)
FINANCIAL YEAR 2026
Sources: *FTSE EPRA/NAREIT DEVELOPED, **FTSE Global Core Infrastructure 50/50 Index
Looking ahead to the 2027 financial year
We remain constructive on the global economic and equity market outlook.
Several supportive themes should continue to drive economic growth and corporate earnings. Risks are not absent, however, and could lift short-term volatility across both the global and domestic economies.
Geopolitical uncertainty
The geopolitical environment remains fragile. Economic risks in the Middle East have eased, but the ceasefire between the US, Israel and Iran is still shaky. Both the US and Iran continue to
signal a desire to end the conflict, each seeking a favourable outcome. The November US midterm elections add further impetus, given the war’s unpopularity across the political spectrum. Markets have historically performed strongly after US midterms, though they will stay sensitive to renewed escalation. Geopolitics is unpredictable by nature, but such conflicts typically have only short-term market impacts. We remain alert to any escalations material enough to move markets.
Structural themes
The AI infrastructure build-out remains the dominant market theme, driven by record and rising capex from global technology companies competing to build the most advanced AI systems. This spending has underpinned both economic growth and equity returns. We expect it to keep growing and to broaden across industries, funding both infrastructure and the deployment of AI tools and services. Benefits should extend to companies that adopt AI to lift sales and operating efficiency, supporting earnings growth.
Other themes support the multi-year outlook. Geopolitical fragmentation has permanently altered the global security architecture, shifting defence from cyclical to secular growth. Reshoring of key
industries is accelerating as nations reduce reliance on others for critical industry inputs. Infrastructure and the energy transition will require substantial capital to expand capacity and improve grid efficiency. These are among the most impactful themes, but technological advances across sectors should provide a broader tailwind to innovation and growth.
Global economic growth
Our base case remains constructive but is best described as a “Below Trend Growth” scenario. The US should retain its growth advantage among developed markets, while others experience more modest growth trajectories. The Australian economy is expected to slow towards a modest pace in the year ahead, but recession remains a low probability. Structural factors continue to sustain global growth, but consumer spending will likely stay subdued despite relatively stable labour markets.
Fiscal spending across major economies should continue to provide support, though the boost from measures such as the Trump administration’s “One Big Beautiful Bill” will likely fade into 2027. Domestically, government spending is also expected to taper in impact, given it already sits at historically extreme levels. A softening housing market will add a further drag on the local economy.
Inflation, interest rates and central bank policies
Global monetary policy has turned notably cautious as central banks manage persistent above-target inflation and shifting growth expectations. Normalising oil prices have eased near-term price
pressures, but central banks are likely to stay cautious while underlying inflation holds above target. AI is expected to be deflationary over the longer term, but in the near term, the investment cycle is driving up demand in key areas, which will place some upward pressure on prices.
We believe the RBA is close to the end of its hiking cycle: inflation appears to be peaking while growth softens, and business and consumer conditions deteriorate. In the US, a new Fed Chair has added uncertainty to the policy path, striking a more restrictive tone than expected. These dynamics have led to a weakening of the Australian dollar (AUD) recently. We remain neutral on the AUD, as it is trading near longer-term fair value.
Fixed income markets
Global bond markets will likely stay range-bound as they weigh inflation against growth pressures. However, domestic government bonds may become more attractive as rising economic risks prompt the RBA to cut interest rates. Nominal yields within domestic credit markets are still attractive on an absolute and relative basis compared to both term deposits and global credit yields with lower risk given wider credit spreads. We retain a bias towards domestic credit within fixed income allocations.
Equity markets and corporate earnings
Global equities have been buoyed by strong earnings and improving forward guidance, particularly from AI beneficiaries. Earnings growth should broaden across industries and regions, widening the sources of equity returns. This durability should support equities over the next 12 months, though a key watch point is whether returns are generated from the significant AI investments. The main risk for global equities is that elevated expectations, if missed, trigger volatility.
Current valuations are fair based on earnings expectations, and the market is not applying excessive valuation multiples even to strongly growing sectors. We are noting pockets of risk where investors have built up significant leverage in sectors such as Semiconductors, Aerospace and Defence.
Domestically, a softer economy will continue to weigh on consumer-facing businesses, while falling house prices and activity pressure the banking sector. We expect Australian earnings growth to hold up but remain below global peers. Australian equities remain attractive for income-oriented portfolios given higher dividend yields relative to global markets.
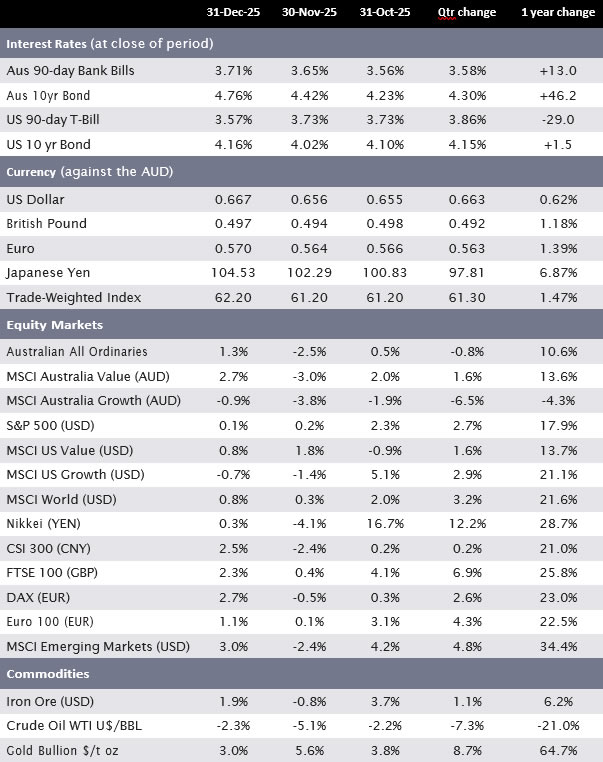
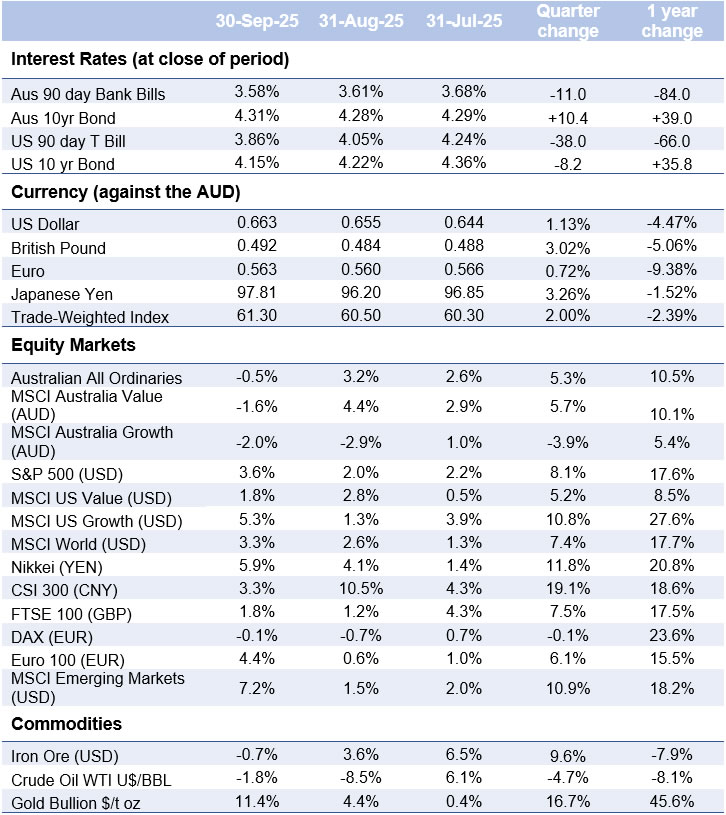
Major market indicators
| 30-Jun-26 | 31-May-26 | 30-Apr-26 | Qtr change | 1 year change | |
| Interest Rates (at close of period) | |||||
| Aus 90-day Bank Bills | 4.46% | 4.43% | 4.34% | +27.0 | +77.0 |
| Aus 10yr Bond | 4.77% | 4.98% | 4.97% | -15.7 | +56.1 |
| US 90-day T-Bill | 3.74% | 3.60% | 3.59% | +13.0 | -50.0 |
| US 10 yr Bond | 4.44% | 4.37% | 4.39% | +12.0 | +21.1 |
| Currency (against the AUD) | |||||
| US Dollar | 0.693 | 0.720 | 0.719 | 1.15% | 5.71% |
| British Pound | 0.519 | 0.533 | 0.529 | 0.12% | 8.85% |
| Euro | 0.603 | 0.615 | 0.610 | 1.11% | 8.02% |
| Japanese Yen | 112.48 | 114.47 | 112.81 | 2.68% | 18.75% |
| Trade-Weighted Index | 64.60 | 66.60 | 66.30 | 0.47% | 7.49% |
| Equity Markets | |||||
| Australian All Ordinaries | 0.4% | 1.2% | 2.4% | 4.0% | 5.7% |
| MSCI Australia Value (AUD) | 0.8% | 1.4% | 1.3% | 3.5% | 16.9% |
| MSCI Australia Growth (AUD) | 2.9% | -1.7% | 2.4% | 3.7% | -12.6% |
| S&P 500 (USD) | -1.0% | 5.3% | 10.5% | 15.2% | 22.3% |
| MSCI US Value (USD) | -0.2% | 2.4% | 7.4% | 9.8% | 18.2% |
| MSCI US Growth (USD) | -1.5% | 8.2% | 13.9% | 21.4% | 24.7% |
| MSCI World (USD) | -0.7% | 4.6% | 9.6% | 13.9% | 21.8% |
| Nikkei (YEN) | 5.7% | 11.9% | 16.1% | 37.4% | 76.0% |
| CSI 300 (CNY) | 2.3% | 1.9% | 8.1% | 12.8% | 29.6% |
| FTSE 100 (GBP) | 1.0% | 0.7% | 2.3% | 4.0% | 23.6% |
| DAX (EUR) | -0.4% | 3.3% | 7.1% | 10.2% | 4.5% |
| Euro 100 (EUR) | 4.7% | 3.7% | 4.4% | 13.3% | 26.7% |
| MSCI Emerging Markets (USD) | -1.4% | 9.7% | 14.7% | 24.1% | 44.2% |
| Commodities | |||||
| Iron Ore (USD) | -6.3% | -1.7% | 1.2% | -6.7% | 7.6% |
| Crude Oil WTI U$/BBL | -22.6% | -16.1% | 5.6% | -31.4% | 6.4% |
| Gold Bullion $/t oz | -12.1% | -0.6% | -0.1% | -12.7% | 22.9% |
Sources: Quilla, Refinitiv Datastream