Summary
Market performance was broadly positive in January, with heightened geopolitical risks and monetary policy shifts creating intra-month volatility and resulting in some notable capital rotations within markets.
Gold and other precious metals were the standout performers, supported by strong ETF flows throughout the month, notwithstanding a sharp reversal on the last trading day of January. Emerging markets performed strongly, also benefitting from increased capital allocations as well as a weakening US dollar and price appreciation from locally based semiconductor manufacturers. US equity markets rotated toward energy, materials, and industrials, as the artificial intelligence (AI) thematic awaits further validation of an uplift in earnings.
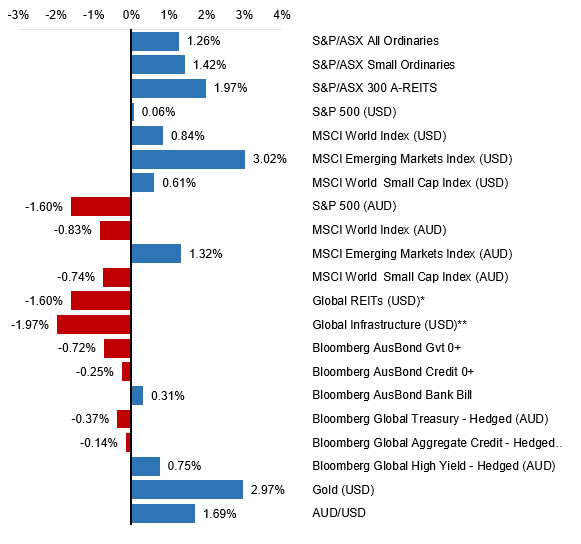
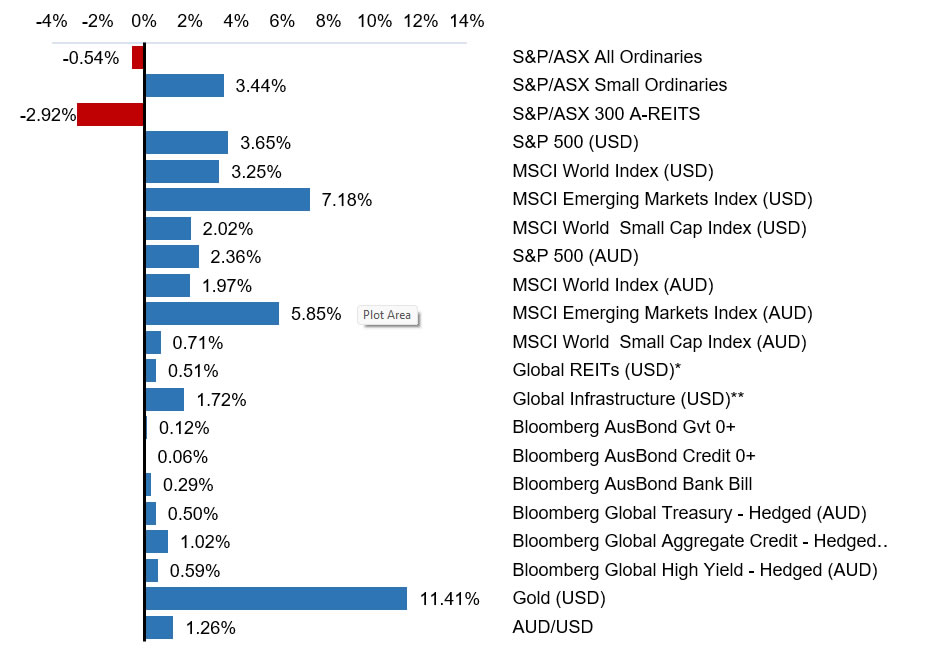
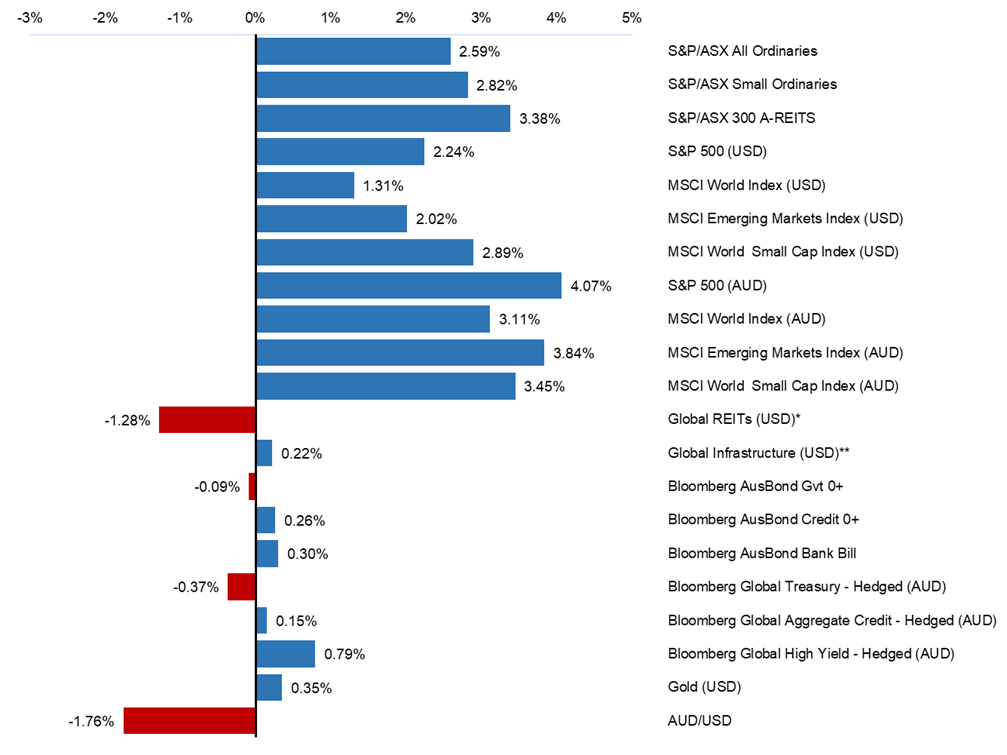
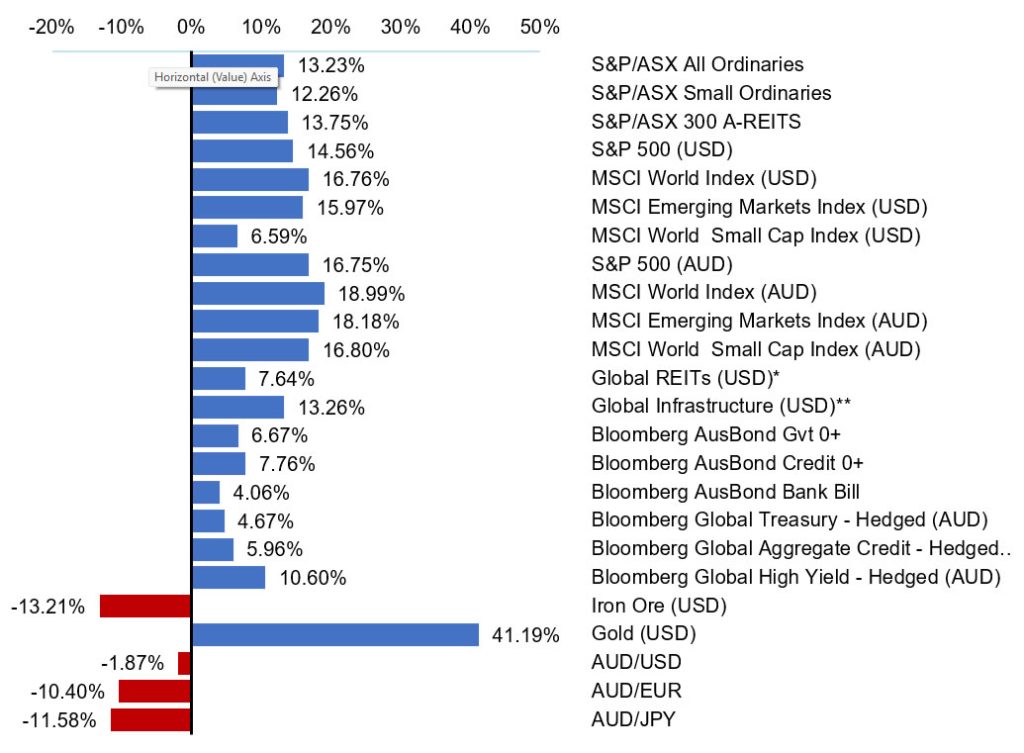
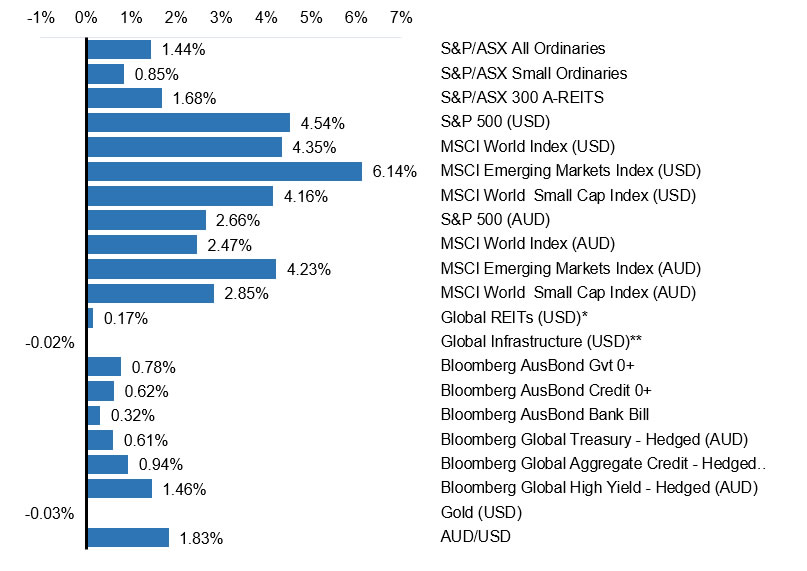
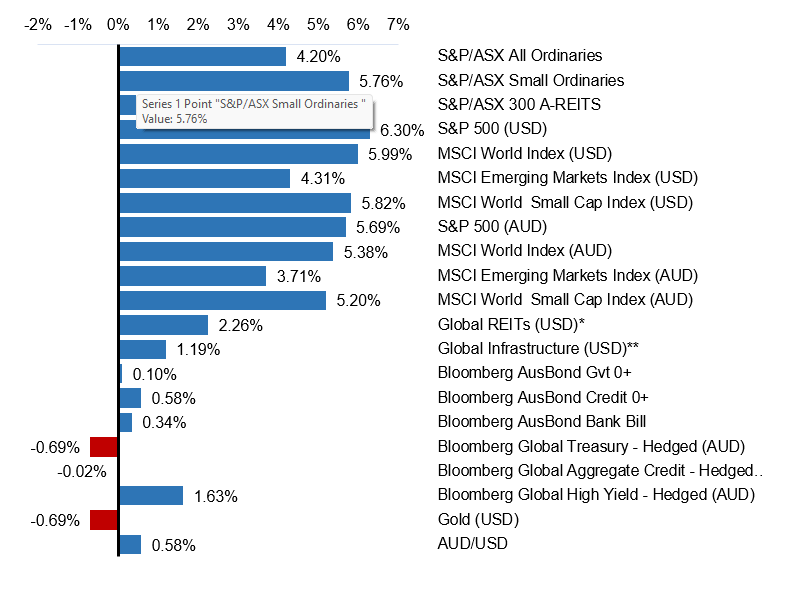
Selected market returns (%)
January 2026
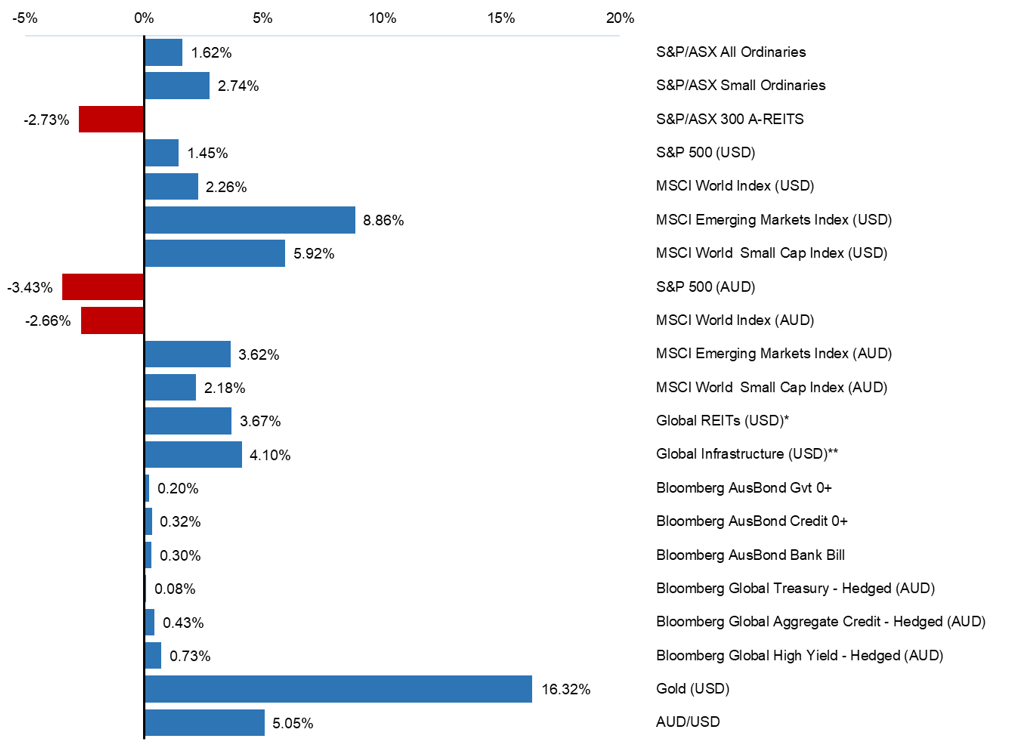
Sources: *FTSE EPRA/NAREIT DEVELOPED, **FTSE Global Core Infrastructure 50/50 Index
Financial markets
Global equity markets rose over January to post modest gains, with the MSCI World Index (USD) up 2.26%. The AI thematic continued to influence markets, with the market preferring hardware over software names. Rising commodity prices also influenced overall market returns, particularly within precious metals. US bond yields increased on the back of firmer labour and inflation data, potentially delaying previously expected near-term rate cuts.
Australian equities
The S&P/ASX All Ordinaries Index made a positive start to the 2026 calendar year, gaining 1.62% in January. Overall market returns were driven primarily by sector rotation, commodity strength, and a reassessment of monetary policy expectations, rather than broad-based risk-on sentiment.
While the ASX delivered modest gains overall, performance was uneven, with index returns heavily influenced by a small number of large resource stocks.
The resources sector was the dominant contributor. Elevated gold prices, supported by geopolitical uncertainty and demand for inflation hedges, underpinned strong performance from gold producers and diversified miners. Strength in copper and other industrial metals further supported materials stocks, with large-cap names such as BHP and Rio Tinto performing well.
By contrast, rising interest rate expectations became a headwind as higher bond yields weighed on equity valuations, particularly for long-duration growth sectors such as technology and REITs. The S&P/ASX Small
Ordinaries Index also gained, returning 2.74%. Performance was strongest in resource-oriented small caps, particularly gold and base-metal explorers and producers, which benefited from elevated commodity prices.
Global equities
Whilst global equity markets trended higher over the month, inflation data across key developed economies, particularly the US, remained firmer than expected, while labour markets remained resilient. This prompted bond markets to react, pushing government bond yields higher. As real yields rose, equity markets began to price less tolerance for elevated multiples, especially in interest-rate-sensitive segments.
Long-duration growth stocks, particularly in technology and consumer discretionary sectors, faced valuation headwinds. In contrast, value-oriented and cyclical sectors such as energy, financials, and industrials attracted flows.
In the US, performance was positive across all major Indices with the S&P 500 Index gaining 1.45% (USD). Small caps also continued their strong run, with the Russell 2000 Index posting positive returns of 5.35% (USD).
Emerging markets returned 8.86% (USD), primarily driven by AI supply chain leadership, a weakening US dollar, and supportive policy shifts in China.
Commodities
Appreciation of the price of gold continued, with the precious metal returning 16.32% (USD) for the month. Momentum buying further amplified gains, with a wave of purchases from speculators adding froth to the rally which exacerbated a pull back on the last day of the month.
West Texas Intermediate (WTI) crude oil also gained 12.64% (USD) as markets grappled with rising geopolitical risks, first with respect to Venezuela and more recently Iran. Oil price gains in January were also supported by production outages in Kazakhstan,
US production freeze offs, and tighter US restrictions on purchases of Russian oil.
Bond markets
US and Australian bond markets were influenced by a repricing of interest rate expectations toward a higher-for-longer outlook.
In the US, firmer inflation data and continued labour market resilience pushed treasury yields higher across the curve, as markets pared back expectations for near-term Federal Reserve rate cuts. The US 10-year treasury yield moved 10bps higher to 4.26%.
Australian bonds followed a similar pattern. Upside surprises in domestic inflation data prompted markets to reassess the likelihood of the Reserve Bank of Australia (RBA) easing, consequently pricing in higher probabilities of monetary tightening. This lifted yields across short and intermediate maturities, while longer-dated bonds remained sensitive to global rate dynamics.
Economic developments
Stubborn inflation
January inflation prints, particularly in the US and Australia, came in firmer than expected, reinforcing concerns of stalling disinflation. January releases drove a material repricing of interest rate expectations, pushing bond yields higher and somewhat weighing on equity valuations, especially in long-duration growth assets.
Domestically, the latest figures showed inflation remaining elevated, with annual headline CPI rising to 3.8% in December, up from 3.4% in November. Underlying inflation also firmed, with the monthly trimmed mean, which removes volatile items, rising 0.2% month-on-month and 3.3% year-on-year. Housing continues to be the largest contributor to CPI, driven by sharp increases in electricity costs, rents, and new dwelling prices, while food and recreation also added upward pressure. The strength in rents and construction costs will make it difficult for overall inflation to return to 2.5% in the near term, particularly with many service categories still rising above 3%.
With inflation still sitting well above the RBA’s 2–3% target range, the data reinforces expectations that the interest-rate cutting cycle has ended unless the labour market deteriorates significantly. As a result, market participants are widely expecting to see the
RBA move to a hiking cycle. In prior meetings, the Board has highlighted that inflation has picked up, although uncertainty remained if this was a temporary spike.
Labour market data
Employment reports showed continued labour market resilience across key developed economies, most notably the US. Strong job growth and wage persistence undermined the case for imminent rate cuts and validated central banks’ cautious stance.
Payroll growth remained solid in the US, the unemployment rate stayed low by historical standards, and participation showed limited deterioration. Importantly for markets, wage growth proved sticky, particularly in the services sectors, signalling ongoing domestic inflation pressure. This combination reduced confidence that inflation would continue to decelerate smoothly and prompted markets to push back expectations for Federal Reserve rate cuts.
Similar dynamics were evident in Australia, where employment growth and low unemployment reinforced the RBA’s cautious stance. Headline labour data suggested demand for labour remained resilient, limiting policymakers’ flexibility.
For investors, the persistence of tight labour conditions mattered less for growth optimism and more for policy credibility where resilient employment implies central banks cannot pivot dovish without risking renewed inflation.
Outlook
Global economic growth is expected to remain resilient but below longer-term trends, supported by broad fiscal stimulus and robust corporate earnings.
Earnings growth is expected to remain a pivotal driver for ongoing equity market performance. As 2026 begins, many major equity markets are benefiting from resilient profit trends, led by the US and parts of Asia.
This trend continues to provide a broadly supportive backdrop for risk assets.
Structural themes, most notably the AI thematic, are reinforcing this outlook. Early signs of revenue acceleration are emerging among a subset of companies, suggesting that recent investment may be starting to translate into commercial outcomes. While confirmation of a durable uplift in earnings is still developing, the medium-term implications are constructive if productivity improvements persist as multi-year growth drivers.
Near-term market conditions are likely to remain volatile as investors respond to shifts in geopolitics, macroeconomic indicators and evolving policy settings. Against this backdrop, portfolio flexibility and diversification remain important disciplines.
Major market indicators
| 31-Jan-26 | 31-Dec-25 | 30-Nov-25 | Qtr change | 1 year change | |
| Interest Rates (at close of period) | |||||
| Aus 90-day Bank Bills | 3.77% | 3.71% | 3.65% | +21.0 | -56.0 |
| Aus 10yr Bond | 4.81% | 4.72% | 4.42% | +57.1 | +32.4 |
| US 90-day T-Bill | 3.58% | 3.57% | 3.73% | -15.0 | -62.0 |
| US 10 yr Bond | 4.26% | 4.16% | 4.02% | +16.4 | -28.8 |
| Currency (against the AUD) | |||||
| US Dollar | 0.701 | 0.667 | 0.656 | 7.01% | 12.31% |
| British Pound | 0.509 | 0.497 | 0.494 | 2.29% | 1.62% |
| Euro | 0.587 | 0.570 | 0.564 | 3.74% | -1.97% |
| Japanese Yen | 107.77 | 104.53 | 102.29 | 6.88% | 11.83% |
| Trade-Weighted Index | 64.50 | 62.20 | 61.20 | 5.39% | 8.22% |
| Equity Markets | |||||
| Australian All Ordinaries | 1.6% | 1.3% | -2.5% | 0.3% | 7.6% |
| MSCI Australia Value (AUD) | 2.6% | 2.7% | -3.0% | 2.2% | 12.0% |
| MSCI Australia Growth (AUD) | -0.4% | -0.9% | -3.8% | -5.0% | -8.9% |
| S&P 500 (USD) | 1.5% | 0.1% | 0.2% | 1.8% | 16.3% |
| MSCI US Value (USD) | 4.5% | 0.8% | 1.8% | 7.1% | 13.7% |
| MSCI US Growth (USD) | -1.9% | -0.7% | -1.4% | -4.0% | 16.6% |
| MSCI World (USD) | 2.3% | 0.8% | 0.3% | 3.4% | 20.1% |
| Nikkei (YEN) | 5.9% | 0.3% | -4.1% | 1.9% | 37.4% |
| CSI 300 (CNY) | 1.8% | 2.5% | -2.4% | 1.8% | 26.6% |
| FTSE 100 (GBP) | 3.0% | 2.3% | 0.4% | 5.7% | 22.0% |
| DAX (EUR) | 0.2% | 2.7% | -0.5% | 2.4% | 12.9% |
| Euro 100 (EUR) | 3.0% | 1.1% | 0.1% | 4.2% | 18.8% |
| MSCI Emerging Markets (USD) | 8.9% | 3.0% | -2.4% | 9.5% | 43.7% |
| Commodities | |||||
| Iron Ore (USD) | -2.6% | 1.9% | -0.8% | -1.5% | -1.1% |
| Crude Oil WTI U$/BBL | 12.6% | -2.3% | -5.1% | 4.5% | -11.4% |
| Gold Bullion $/t oz | 16.3% | 3.0% | 5.6% | 26.4% | 79.0% |
Sources: Quilla, Refinitiv Datastream
Important information
Quilla Consulting Pty Ltd (Quilla) holds AFSL 511401. This document provides general advice only and not personal financial advice. It does not take into account your objectives, financial situation or needs. Before acting or making any investment decision, you should consider your personal financial situation or needs, consult a professional adviser, and consider any applicable disclosure documents.
Information in this document is based on sources believed to be reliable, but Quilla does not guarantee its accuracy. All opinions expressed are honestly held as at the applicable date. Neither the information, nor any opinion expressed, constitutes an offer, or invitation, to buy or sell any financial products.
Quilla does not accept any liability to any person or institution who relies on this document and the information it contains and shall not be liable for any loss or damage caused to any person in respect of this document and the information it contains. You must not copy, modify, sell, distribute, adapt, publish, frame, reproduce or otherwise use any of the information in this document without the prior written consent of Quilla.