Summary
In March, global markets were shaped by escalating geopolitical tensions following the US–Israeli conflict with Iran, and the resulting disruption to the Strait of Hormuz. The partial closure of this critical energy corridor, which typically facilitates around 20% of global oil supply, triggered a significant supply shock. As a result, crude oil prices surged above US$100 per barrel for the first time since 2022, materially shifting inflation expectations and complicating the global monetary policy outlook.
Rising inflation expectations pushed global bond yields higher, as investors increasingly priced in the likelihood that central banks may need to tighten policy further to contain inflationary pressures. Equity markets responded with broad-based declines, with the impact most pronounced in oil-importing regions such as Australia, Asia, and Europe.
In contrast, the United States remained relatively insulated given its position as a net energy exporter.
Domestically, the Reserve Bank of Australia (RBA) raised the cash rate by 25 basis points at its March meeting following a closely contested decision, citing persistent inflation pressures exacerbated by the energy shock. Meanwhile, most major global central banks opted to hold rates steady, awaiting greater clarity on the evolving geopolitical situation.
Australian 10-year bond yields rose sharply, moving above 5%, while the Australian dollar weakened against the US dollar amid a deteriorating global growth outlook. Gold prices declined from their January highs, as investors repositioned portfolios and liquidated positions to meet margin calls.
Selected market returns (%)
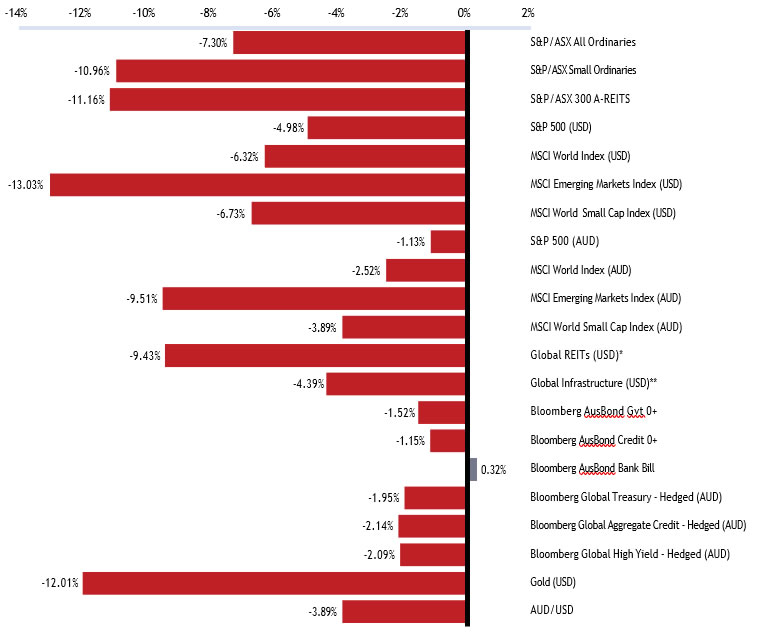
Sources: *FTSE EPRA/NAREIT DEVELOPED, **FTSE Global Core Infrastructure 50/50 Index
Financial markets
Global equity markets experienced a pronounced risk-off correction in March, driven by escalating US–Israeli military operations against Iran that culminated in a severe disruption to global energy supplies. Heightened geopolitical uncertainty fueled sharp intra-month volatility, with investor sentiment swinging rapidly between risk-on and risk-off in response to real-time developments and shifting conflict dynamics.
The expected sharp rise in headline inflation, driven by the oil and gas supply shock, triggered concurrent selloffs in both equities and fixed income.
Australian equities
The S&P/ASX All Ordinaries Index fell 7.3% in March, with the market hit by the dual headwinds of the RBA’s second consecutive rate hike and the global energy shock. The sell-off was broad-based, with rate-sensitive sectors bearing the brunt of the move.
The RBA’s decision to raise the cash rate on 17 March weighed heavily on the technology and real estate sectors. The technology sector extended its losing streak to eight consecutive months, ending March down 12.49% and the quarter down approximately 28%. Real estate stocks came under further pressure as bond yields surged above 5%.
The resources sector delivered mixed results. Energy stocks rallied sharply on the back of surging oil prices, with producers benefiting from the conflict-driven price spike. In contrast, gold stocks suffered, following a lower gold price.
Small caps fell disproportionately, with the S&P/ASX Small Ordinaries Index declining further as higher rates and rising input costs increased expectations for tighter margins for smaller companies with less pricing power.
Global equities
Global equity markets diverged markedly in March, with the Middle East conflict creating clear winners and losers across regions and sectors.
In the United States, the S&P 500 fell 5% (USD), recording its worst monthly performance since 2023. Technology stocks led losses, with the Nasdaq declining by over 7% (USD) as rising bond yields compressed valuations for long-duration growth names. The conflict added to existing anxieties about AI monetisation and the technology sector’s earnings trajectory, leading investors to reassess valuations.
Small-cap stocks bore the brunt of the selloff, with the Russell 2000 dropping by over 7% in March.
The decline reflected disproportionate selling of companies with high levels of floating-rate debt and heavy cyclical exposure, who are more sensitive to surging energy costs and faltering growth expectations.
Japanese equities suffered the most severe correction globally. The Nikkei 225 fell 13.2% (JPY), its worst month since the 2008 Global Financial Crisis (GFC), as Japan’s heavy reliance on Middle Eastern oil imports amplified the impact of the supply shock. Rising energy costs and a strengthening yen, driven by safe-haven demand, further pressured export-oriented sectors.
Emerging and European markets surrendered early-2026 gains in March as the Middle East conflict, surging oil prices, and softer economic data took their toll. Both regions fared worse than the US, facing outsize exposure to cyclical sectors and energy costs. Growth forecasts were reassessed as markets absorbed the gravity of oil disruption on economic outlooks.
Commodities
Crude oil was the defining commodity story in March. WTI surged approximately 53.6% to settle above US$100 per barrel, its first close above US$100 since July 2022 and its strongest monthly gain since May 2020.
Gold fell sharply in March, declining approximately 12% (USD) from its January highs near US$5,419 to close around US$4,674 per ounce. The sell-off reflected forced liquidation by leveraged investors facing margin calls in equity and bond markets, as well as a stronger US dollar. Despite the monthly decline, the gold price remained more than 40% above its level a year ago.
Iron ore prices rose 8.8% in March 2026, supported by supply disruptions and elevated freight costs from the Iran conflict, despite weak underlying Chinese steel demand.
Bond markets
Bond markets faced a challenging month as the oil-driven inflation shock pushed yields sharply higher across major economies.
In the US, the 10-year Treasury yield rose approximately 38 basis points to close at 4.32%, its highest level since July 2025. Markets significantly scaled back expectations for the Federal Reserve (the Fed) to cut rates, with some traders beginning to price in the possibility of a rate hike in the fourth quarter of 2026. The Fed held rates steady at its March meeting, with Chair Powell noting that
oil-driven supply shocks were largely beyond the central bank’s control.
In Australia, the 10-year government bond yield surged above 5.0%, its highest since 2011, driven by the RBA’s back-to-back rate hikes and the inflationary implications of higher energy costs.
The 90-day bank bill rate rose in line with the RBA’s hike, with markets pricing in a further increase in May.
Economic developments
The Iran war and the oil shock
The defining event of March was the escalation of the US-Israeli military conflict with Iran, which began with strikes on 28 February and rapidly broadened into a regional confrontation. Within days, Iran retaliated by effectively closing the Strait of Hormuz to commercial shipping, removing a critical chokepoint through which roughly 20% of the world’s seaborne oil had transited.
Beyond energy, the Iran conflict has disrupted supplies of critical industrial inputs: urea prices have surged, threatening crop yields and food security; aluminum production has contracted; and helium shortages pose risks to semiconductor and medical imaging sectors.
The conflict intensified throughout the month. The United States deployed additional carrier strike groups to the region, with reports emerging that the Pentagon was preparing for ground operations. Iran-backed Houthi militants in Yemen also entered the conflict, targeting Israeli and regional shipping.
By month’s end, tentative signals of a willingness to negotiate emerged from both sides, though the situation remained highly fluid. Reports suggested President Trump was open to ending operations even without the full reopening of the strait, while unconfirmed reports indicated Iran was also open to talks. Oil markets, however, remained skeptical of a near-term resolution, and the war premium in energy prices continued to dominate market pricing.
A second hike in a row
The RBA raised the official cash rate by 25 basis points to 4.10% at its March meeting, the second consecutive hike and the third increase in the current tightening cycle. The decision was split 5-4, with the minority preferring to wait for further data given the heightened global uncertainty.
Governor Michele Bullock was unequivocal in the post-decision press conference that inflation was already too high before the Middle East conflict began, and the domestic data had confirmed that demand was outstripping supply. She noted that headline CPI had risen to 3.8% and the labour market remained tighter than expected, with the unemployment rate holding below forecast.
The war in the Middle East introduced a significant complication. Rising fuel prices were expected to feed directly into headline inflation while also squeezing household budgets. Economists warned that CPI could accelerate toward 4.5% in the near term and potentially approach 5% in the second quarter if energy costs remained elevated. Markets moved to price in a third consecutive hike at the May meeting.
Outlook
The global economic outlook has become more clouded in March, with the Middle East conflict introducing a potential stagflationary risk since the post-pandemic period. The surge in oil prices threatens to simultaneously lift inflation and depress economic activity, creating a particularly challenging environment.
For risk assets, the near-term trajectory will be heavily influenced by the resolution or escalation of the Iran conflict. A de-escalation and reopening of the Strait of Hormuz would likely trigger a significant relief rally, particularly in energy-importing markets and across the technology sector, where valuations have compressed on higher discount rates. A prolonged conflict, conversely, would weigh on the global economic growth outlook and corporate earnings growth.
Despite recent volatility, expectations for global corporate earnings remain resilient. Revenue and earnings growth continue to support a positive equity outlook, particularly within the AI theme, where massive capital investment acts as a powerful tailwind. The proliferation of AI is also expected to produce tangible productivity gains, boosting both economic growth and corporate profitability across sectors.
While the medium-term structural case for AI investment remains intact, the market’s attention has shifted decisively toward energy security, inflation, and the policy response. Sector performance is likely to remain uneven until the macro environment stabilises.
We continue to monitor the situation in the Middle East closely, specifically the duration of oil supply disruptions through the Strait of Hormuz and their potential impact on the global and domestic economic trajectory.
Near-term conditions are likely to remain volatile as investors navigate evolving conditions. In this environment, portfolio adaptability and diversification are of utmost importance.
Major market indicators
| 31-Mar-26 | 28-Feb-26 | 31-Jan-26 | Qtr change | 1 year change | |
| Interest Rates (at close of period) | |||||
| Aus 90-day Bank Bills | 4.19% | 3.96% | 3.77% | +48.0 | +7.0 |
| Aus 10yr Bond | 4.96% | 4.76% | 4.75% | +24.3 | +54.1 |
| US 90-day T-Bill | 3.61% | 3.59% | 3.58% | +4.0 | -60.0 |
| US 10 yr Bond | 4.32% | 3.96% | 4.26% | +15.8 | +11.0 |
| Currency (against the AUD) | |||||
| US Dollar | 0.685 | 0.713 | 0.701 | 2.71% | 9.91% |
| British Pound | 0.519 | 0.528 | 0.509 | 4.30% | 7.01% |
| Euro | 0.597 | 0.603 | 0.587 | 4.63% | 2.97% |
| Japanese Yen | 109.55 | 111.15 | 107.77 | 4.80% | 17.09% |
| Trade-Weighted Index | 64.30 | 65.50 | 64.50 | 3.38% | 7.89% |
| Equity Markets | |||||
| Australian All Ordinaries | -7.3% | 3.3% | 1.6% | -2.7% | 11.3% |
| MSCI Australia Value (AUD) | -4.7% | 7.6% | 2.6% | 5.2% | 21.4% |
| MSCI Australia Growth (AUD) | -6.6% | 0.8% | -0.4% | -6.2% | -5.5% |
| S&P 500 (USD) | -5.0% | -0.8% | 1.5% | -4.3% | 17.8% |
| MSCI US Value (USD) | -5.2% | 1.8% | 4.5% | 0.8% | 11.4% |
| MSCI US Growth (USD) | -4.5% | -3.8% | -1.9% | -9.9% | 22.5% |
| MSCI World (USD) | -6.3% | 0.8% | 2.3% | -3.5% | 19.4% |
| Nikkei (YEN) | -12.6% | 10.4% | 5.9% | 2.2% | 45.9% |
| CSI 300 (CNY) | -5.5% | 0.2% | 1.8% | -3.7% | 17.7% |
| FTSE 100 (GBP) | -6.2% | 7.0% | 3.0% | 3.4% | 22.6% |
| DAX (EUR) | -10.3% | 3.0% | 0.2% | -7.4% | 2.3% |
| Euro 100 (EUR) | -5.9% | 4.2% | 3.0% | 1.0% | 15.5% |
| MSCI Emerging Markets (USD) | -13.0% | 5.5% | 8.9% | -0.1% | 30.3% |
| Commodities | |||||
| Iron Ore (USD) | 8.8% | -5.2% | -2.6% | 3.1% | 5.0% |
| Crude Oil WTI U$/BBL | 53.6% | 3.8% | 12.6% | 59.5% | 43.1% |
| Gold Bullion $/t oz | -12.0% | 4.4% | 16.3% | -8.1% | 47.9% |
Sources: Quilla, Refinitiv Datastream