Summary
Global markets continued to rally during May. Equities were driven higher by strong
US company earnings and hopes for a resolution to the US-Iran conflict. Crude oil prices remained elevated, above $100 for much of the month, as US-Iran negotiations were drawn out. This also resulted in fears of higher, more persistent inflation, which weighed on government bond yields.
The impacts of higher oil prices were evident in recent economic data. The US Consumer Price Index (CPI) rose from 3.3% in March to 3.8% in April, with similar trends observed in the Eurozone and Australia. The Reserve Bank of Australia (RBA) lifted the domestic cash rate to 4.35%, citing inflation concerns. Expectations for further RBA rate hikes have stabilised, with one additional rate hike priced in for the rest of the year.
The Federal Reserve (Fed), European Central Bank (ECB), Bank of England (BoE), and Bank of Japan (BoJ) all held rates steady in their late April meetings. However, market participants have now priced in rate hikes for each of these major central banks through 2026.
The Australian equity market underperformed global equities. This was due to a lack of
ASX-listed artificial intelligence (AI) beneficiaries and negative sentiment following the Federal Budget earlier in the month. The Big 4 banks sold off following the Budget as it negatively weighed on the housing outlook and bank credit growth.
The Australian 10-year bond yield remained rangebound between 4.9% and 5.1% through May. The Australian dollar similarly traded sideways between $0.710 and $0.725.
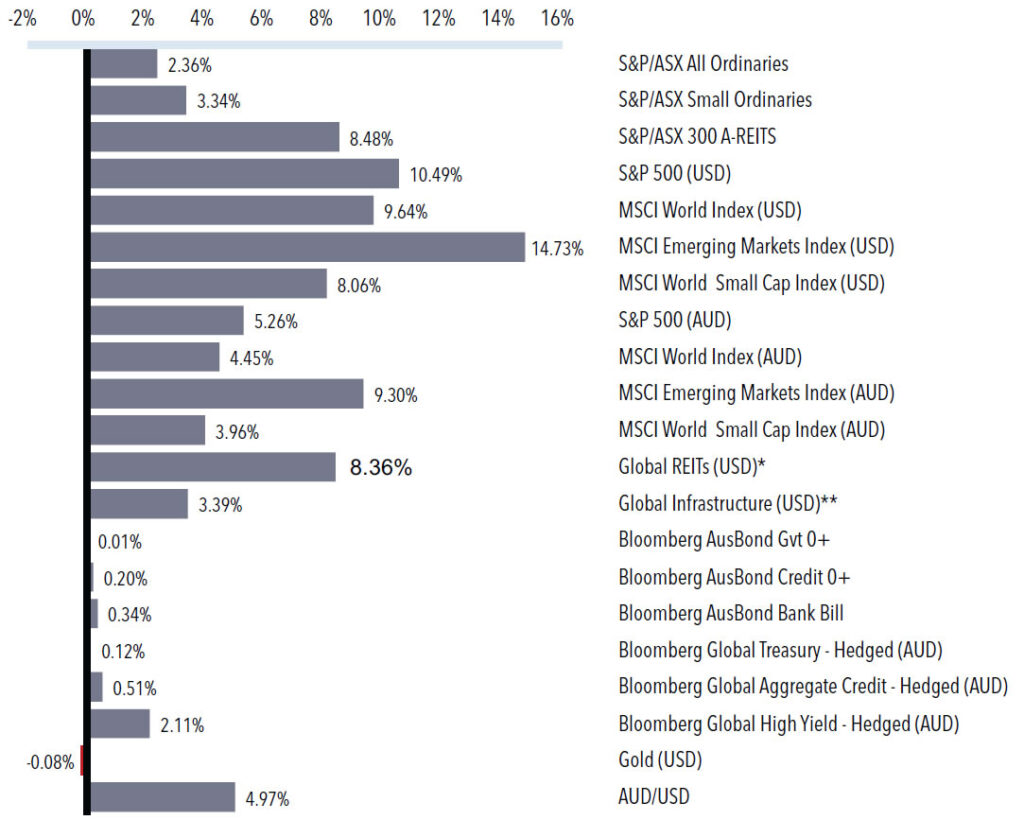
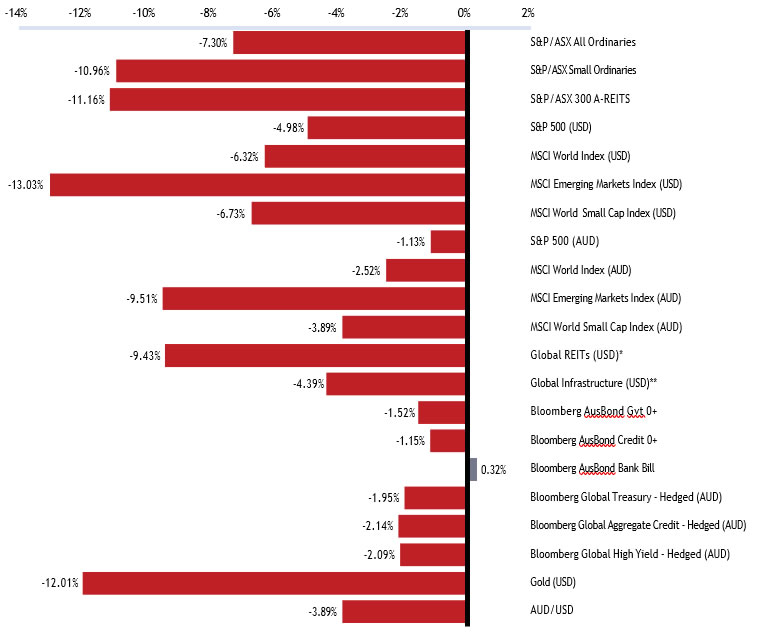
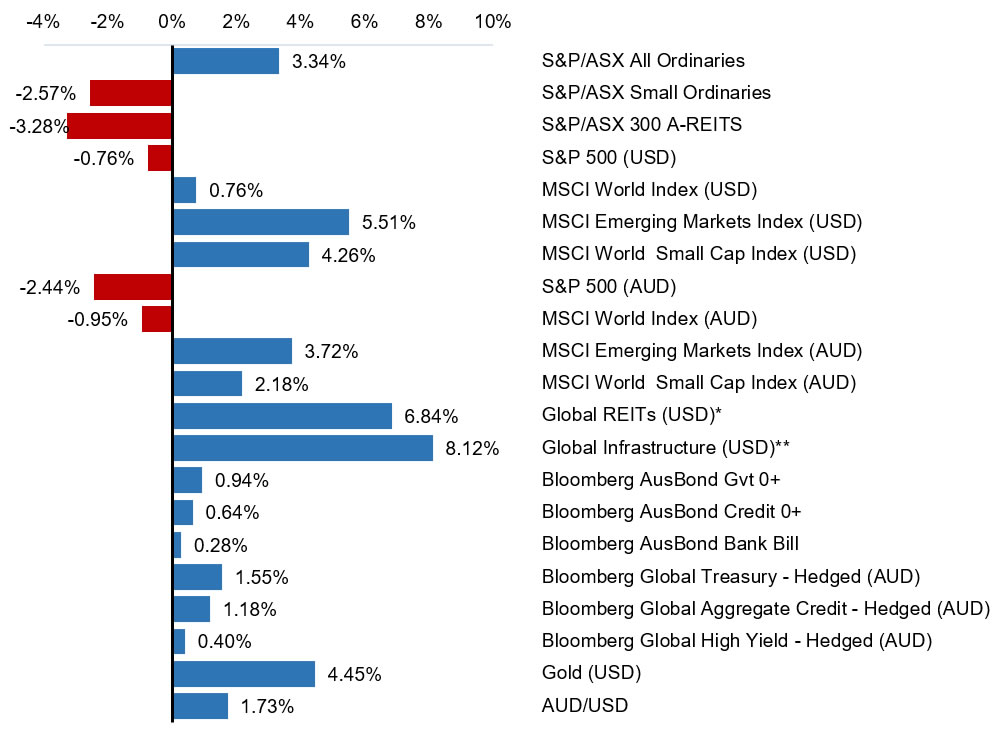
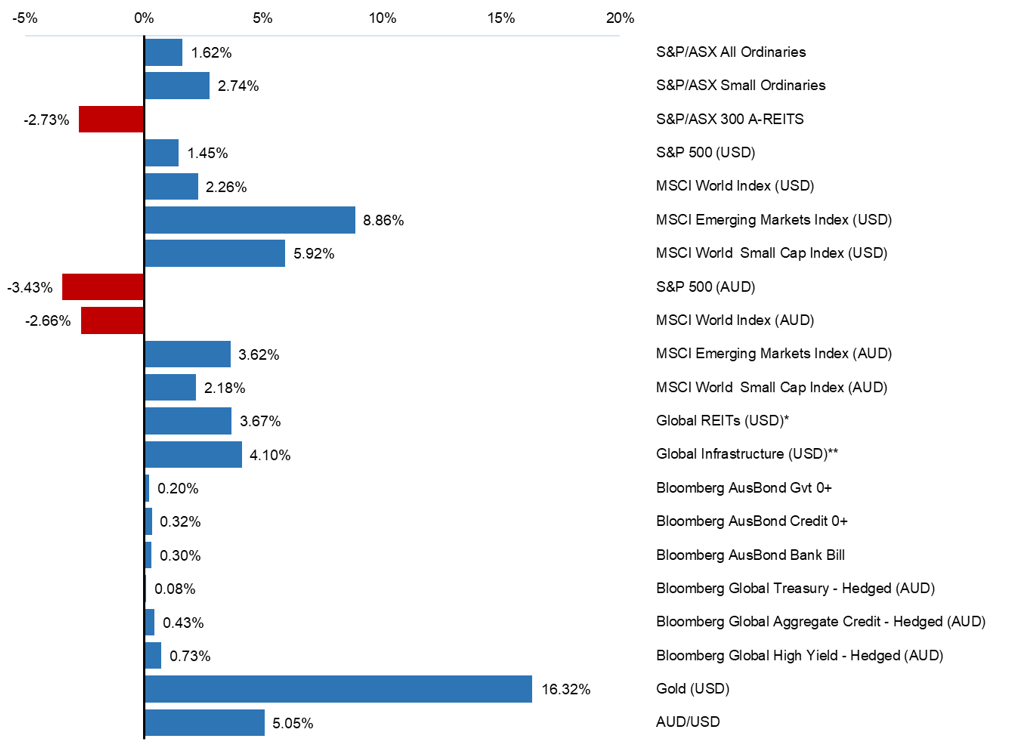
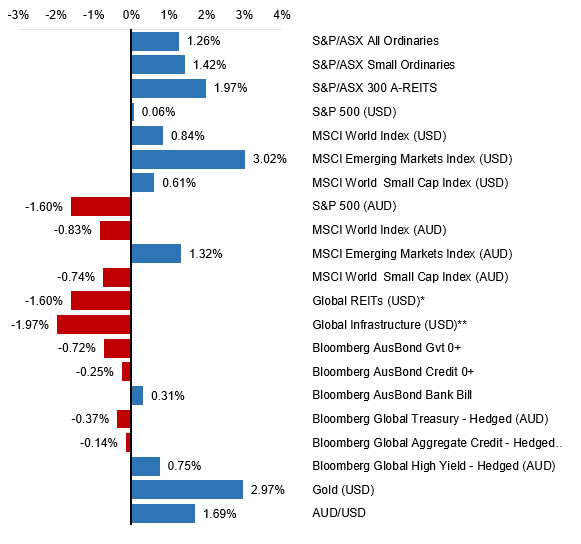
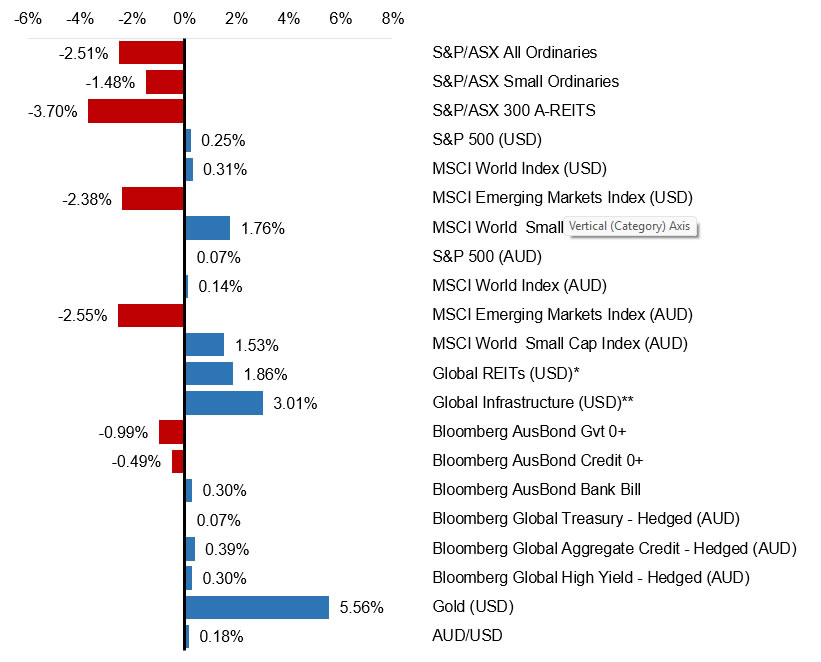
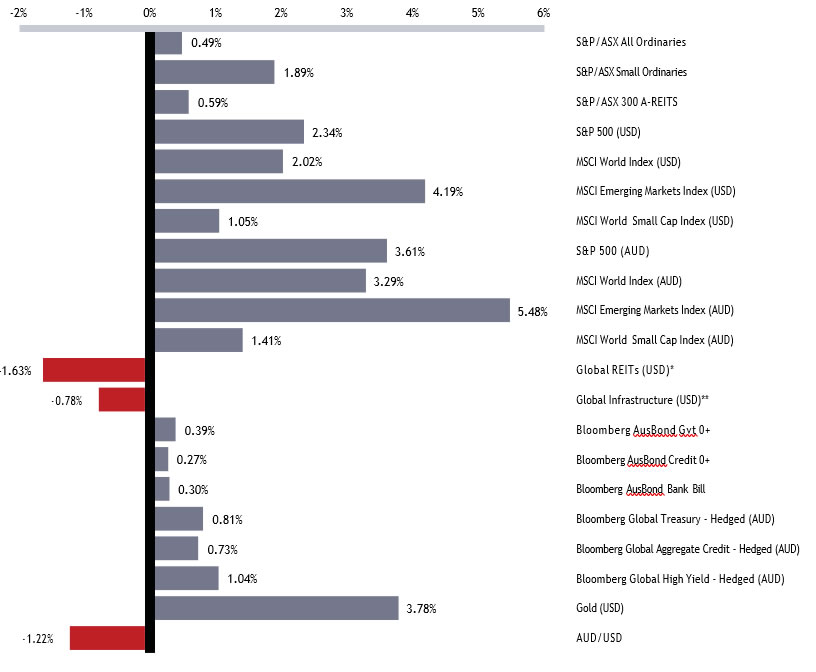
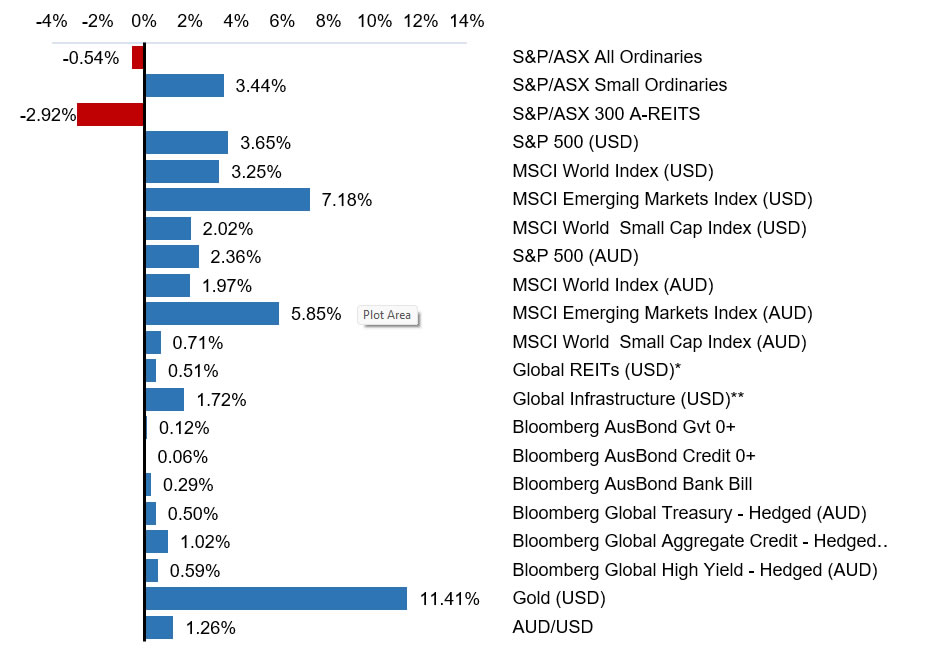
Selected market returns (%)
MAY 2026
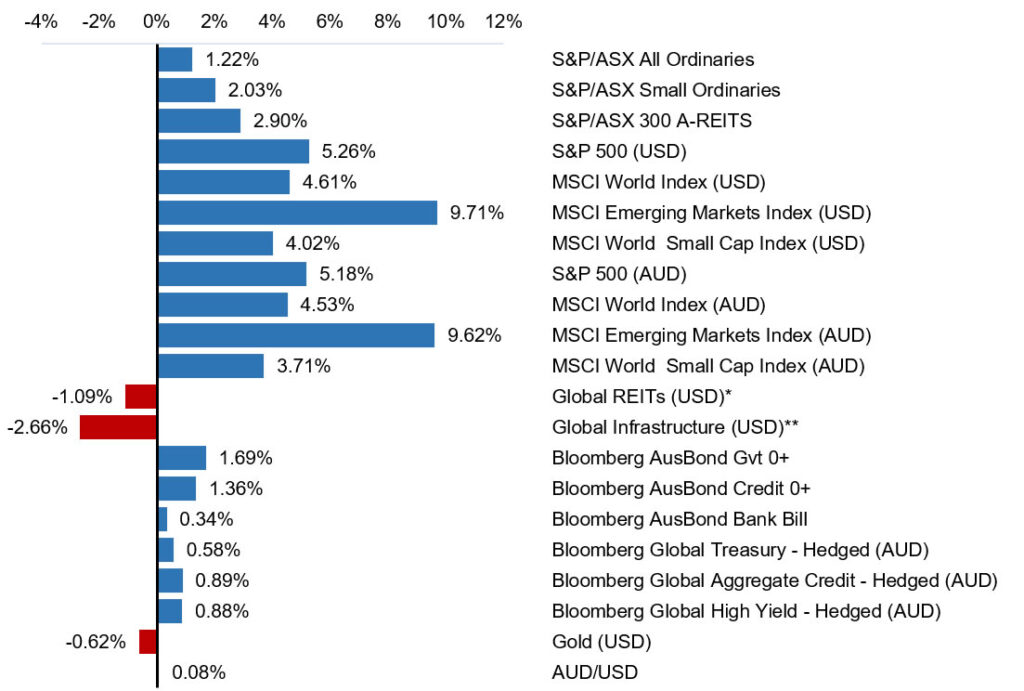
Sources: *FTSE EPRA/NAREIT DEVELOPED, **FTSE Global Core Infrastructure 50/50 Index
KEY MARKET AND ECONOMIC DEVELOPMENTS IN MAY 2026
Financial markets
Risk assets continued to rally through May, driven by a positive US earnings season and a continued compression of credit spreads. The rally was led by the US technology sector and emerging markets. The Magnificent 7 reported strong earnings results and upgraded
AI capital expenditure guidance, which also provided support for semiconductor companies.
Australian equities
The S&P/ASX All Ordinaries Index experienced intra-month volatility, driven by negative sentiment following the RBA rate hike and uncertainty following the Federal Budget. The market expects changes to Capital Gains Tax (CGT) and negative gearing policy to weigh on the Australian property market, prompting a sell-off in the Big Four banks. This uncertainty is likely to persist until the policy is finalised and legislated. Australian equities recovered to close the month up 1.22%, supported by easing Middle East tensions.
The materials sector rose 10% during the month, driven by a strong price rally in base metals, whereas the healthcare sector continued to underperform, falling 10%, largely driven by CSL, which released another earnings downgrade resulting in a sharp selloff in the stock.
Small caps continued to outperform large caps. The S&P/ASX Small Ordinaries Index rose 2.03%,
largely driven by resources stocks.
Global equities
Global equity markets delivered strong returns in May. The MSCI World Index rose 4.61% (USD), led
by the US and Japan.
In the US, the S&P500 rose 5.26% (USD) on the back of an upbeat earnings season and strong investor flows into AI beneficiaries within the technology sector. The remaining sectors such as financials, industrials, healthcare and consumer staples saw more modest gains.
Japanese equities experienced an 11.9% (JPY) rally, led by the technology sector. The yen weakened
modestly during the month.
Emerging markets equities also saw a strong rally, gaining 9.7% in May. Large semiconductor companies (TSMC, Samsung and SK Hynix), which account for 24% of the index, drove a majority of the rally, benefitting from strong AI capital expenditure guidance from the Magnificent 7.
Commodities
Crude oil prices remained volatile throughout May, briefly rising above US$100 per barrel before finishing the month at US$88. Price movements were driven by ongoing uncertainty surrounding negotiations between the United States and Iran, as well as intermittent military activity in the region. While tensions have generally eased and a tentative agreement to extend the ceasefire was reached late in the month, the timing of a lasting resolution and the full reopening of the Strait of Hormuz remains uncertain.
Gold prices were also volatile during May. The precious metal continued to benefit from geopolitical uncertainty and a softer US dollar, although gains were tempered by elevated US Treasury yields and expectations that the Federal Reserve may maintain a restrictive policy stance for longer than previously anticipated.
Bond markets
Bond markets continued to face headwinds in May due to sticky inflation fears placing upward pressure on government bond yields. Above target inflation has seen markets shift to expecting rate hikes in both the US and Europe. The US 10-year Treasury yield peaked at 4.66% during the month, its highest level in over a year, while the US 30-year also traded up to 5.18%, the highest level since late 2023. Kevin Warsh was sworn in as the new Federal Reserve (Fed) Chair on 22 May 2026. Bond markets will be monitoring his stance on rate policy and Fed balance sheet reduction.
The Australian 10-year government bond yield fluctuated between 4.9% to 5.1% before ending the month at 4.89%, as market fears of persistent inflation subsided due to the continued de-escalation between the US and Iran.
Economic developments
Budget lands with tax sting
The Australian Federal Budget was a key focus in May, with proposed changes to CGT and negative gearing attracting particular attention. Whilst the changes remain subject to legislation, as currently proposed, from 1 July 2027 the existing 50% CGT discount for individuals, trusts and partnerships would be replaced with cost-base indexation and a minimum 30% tax rate on capital gains. Negative gearing for residential property would also be limited to new builds, with the policy framed as a measure to improve housing affordability.
For investors, the potential implications are significant. If implemented in their current form, thechanges may reduce the after-tax attractiveness of long-held growth assets and established residential property investments. This could encourage some investors to reassess portfolio positioning, with greater emphasis on income, liquidity and tax efficiency.
In the near term, the proposed changes have added to uncertainty in the housing market. Forward-looking indicators have softened, with Sydney auction clearance rates falling below 50% and Westpac’s “time to buy a dwelling” index declining to an 18-month low.
The data starts to crack
Australia’s data deteriorated through May, challenging the economy’s ability to absorb further tightening. The RBA raised the cash rate by 25 basis points to 4.35%. This was followed by a soft domestic jobs report which saw the unemployment rate increase to 4.5% in April, its highest level since late 2021. Business confidence remained deeply negative as rising prices weigh on margins, forward orders and demand. Consumer confidence improved slightly in May but remained at recessionary levels, with households under pressure from petrol prices, mortgage costs and weak real income growth.
Economists pushed back their RBA rate hike expectations following the run of soft data. Market pricing has now shifted to a higher-for-longer profile, with the RBA’s May forecasts assuming the cash rate rises to around 4.70% by the end of 2026.
A similar narrative played out offshore with higher inflation forcing a more hawkish outlook. US inflation reaccelerated, with PCE inflation rising to 3.8% year-on-year in April and core PCE lifting to 3.3%, both still well above the Fed’s 2% target. Markets have now pushed out expectations for Fed easing and began pricing rate hikes in 2026.
Outlook
The global economic outlook has improved over recent months as geopolitical tensions have eased. Signs of de-escalation in the conflict between the United States and Iran have reduced the immediate risk of a prolonged disruption to global energy supplies. A sustained reduction in tensions would be supportive of financial markets, particularly if lower energy prices help moderate inflationary pressures and provide central banks with greater flexibility to ease monetary policy.
Market sentiment continues to be underpinned by resilient corporate earnings and ongoing investment in artificial intelligence and digital infrastructure, particularly across the technology and semiconductor sectors. While inflation and central bank policy remain important considerations, investors have increasingly shifted their focus back toward company fundamentals, productivity improvements and long-term growth opportunities.
In Australia, the outlook remains more nuanced. Proposed changes announced in the Federal Budget have introduced uncertainty for investors, households and parts of the financial sector, particularly in relation to housing and taxation policy. Offsetting this, higher commodity prices continue to support the resources sector and provide an important tailwind for the domestic economy. In this environment, maintaining a diversified portfolio and focusing on high-quality businesses with resilient earnings and strong balance sheets remains key to navigating an evolving market landscape.
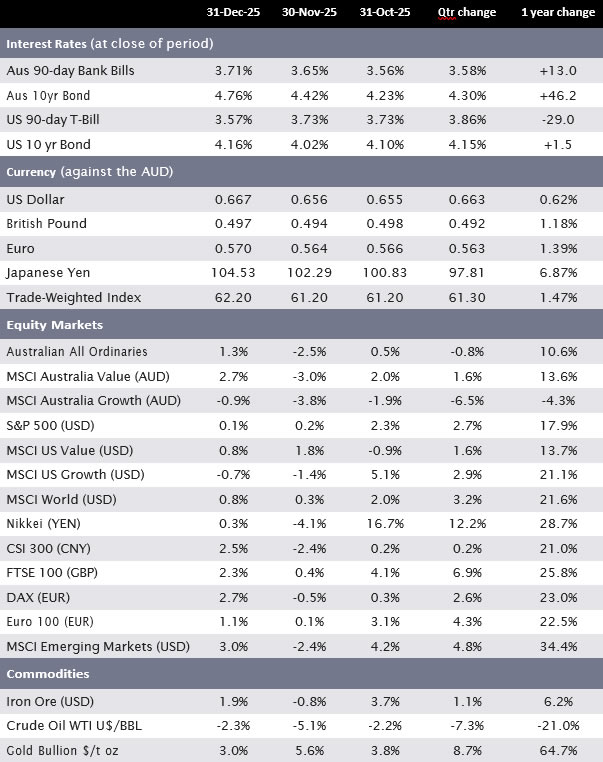
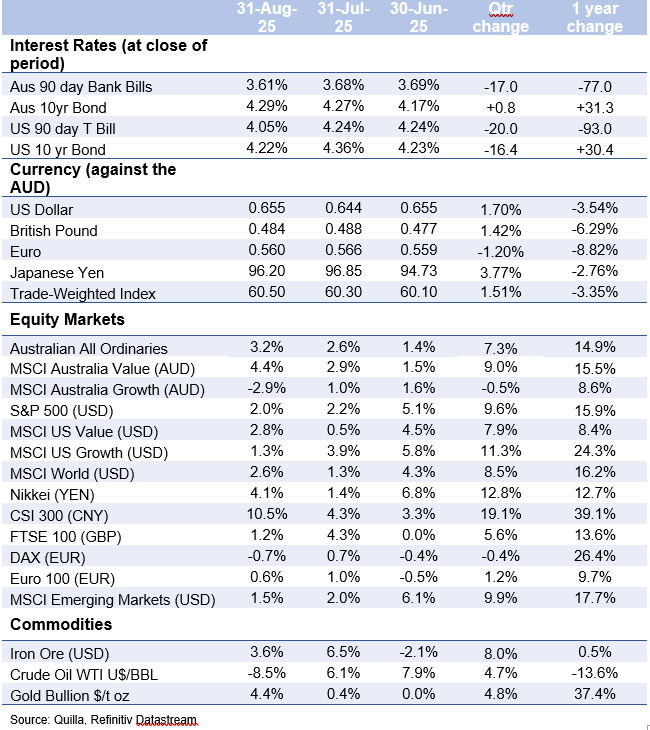
Major market indicators
| 31-May-26 | 30-Apr-26 | 31-Mar-26 | Qtr change | 1 year change | |
| Interest Rates (at close of period) | |||||
| Aus 90-day Bank Bills | 4.43% | 4.34% | 4.19% | +47.0 | +65.0 |
| Aus 10yr Bond | 4.89% | 4.97% | 4.93% | +13.2 | +54.0 |
| US 90-day T-Bill | 3.60% | 3.59% | 3.61% | +1.0 | -65.0 |
| US 10 yr Bond | 4.44% | 4.39% | 4.32% | +47.3 | +5.0 |
| Currency (against the AUD) | |||||
| US Dollar | 0.720 | 0.719 | 0.685 | 0.96% | 11.80% |
| British Pound | 0.533 | 0.529 | 0.519 | 0.97% | 11.64% |
| Euro | 0.615 | 0.610 | 0.597 | 2.01% | 8.54% |
| Japanese Yen | 114.47 | 112.81 | 109.55 | 2.98% | 23.48% |
| Trade-Weighted Index | 66.60 | 66.30 | 64.30 | 1.68% | 11.74% |
| Equity Markets | |||||
| Australian All Ordinaries | 1.2% | 2.4% | -7.3% | -4.0% | 6.8% |
| MSCI Australia Value (AUD) | 1.4% | 1.3% | -4.7% | -2.1% | 17.7% |
| MSCI Australia Growth (AUD) | -1.7% | 2.4% | -6.6% | -5.9% | -13.8% |
| S&P 500 (USD) | 5.3% | 10.5% | -5.0% | 10.5% | 29.8% |
| MSCI US Value (USD) | 2.4% | 7.4% | -5.2% | 4.3% | 23.8% |
| MSCI US Growth (USD) | 8.2% | 13.9% | -4.5% | 17.7% | 33.9% |
| MSCI World (USD) | 4.6% | 9.6% | -6.3% | 7.4% | 28.0% |
| Nikkei (YEN) | 11.9% | 16.1% | -12.6% | 13.5% | 77.8% |
| CSI 300 (CNY) | 1.9% | 8.1% | -5.5% | 4.1% | 30.9% |
| FTSE 100 (GBP) | 0.7% | 2.3% | -6.2% | -3.3% | 22.5% |
| DAX (EUR) | 3.3% | 7.1% | -10.3% | -0.7% | 4.6% |
| Euro 100 (EUR) | 3.7% | 4.4% | -5.9% | 1.8% | 20.5% |
| MSCI Emerging Markets (USD) | 9.7% | 14.7% | -13.0% | 9.5% | 55.1% |
| Commodities | |||||
| Iron Ore (USD) | -1.7% | 1.2% | 8.8% | -0.5% | 12.3% |
| Crude Oil WTI U$/BBL | -16.1% | 5.6% | 53.6% | -11.4% | 48.3% |
| Gold Bullion $/t oz | -0.6% | -0.1% | -12.0% | -0.7% | 39.7% |
Sources: Quilla, Refinitiv Datastream